UnderDoc Tutorial - Expense Analytics using Metabase and LLM with receipt/invoice images (Part 1)
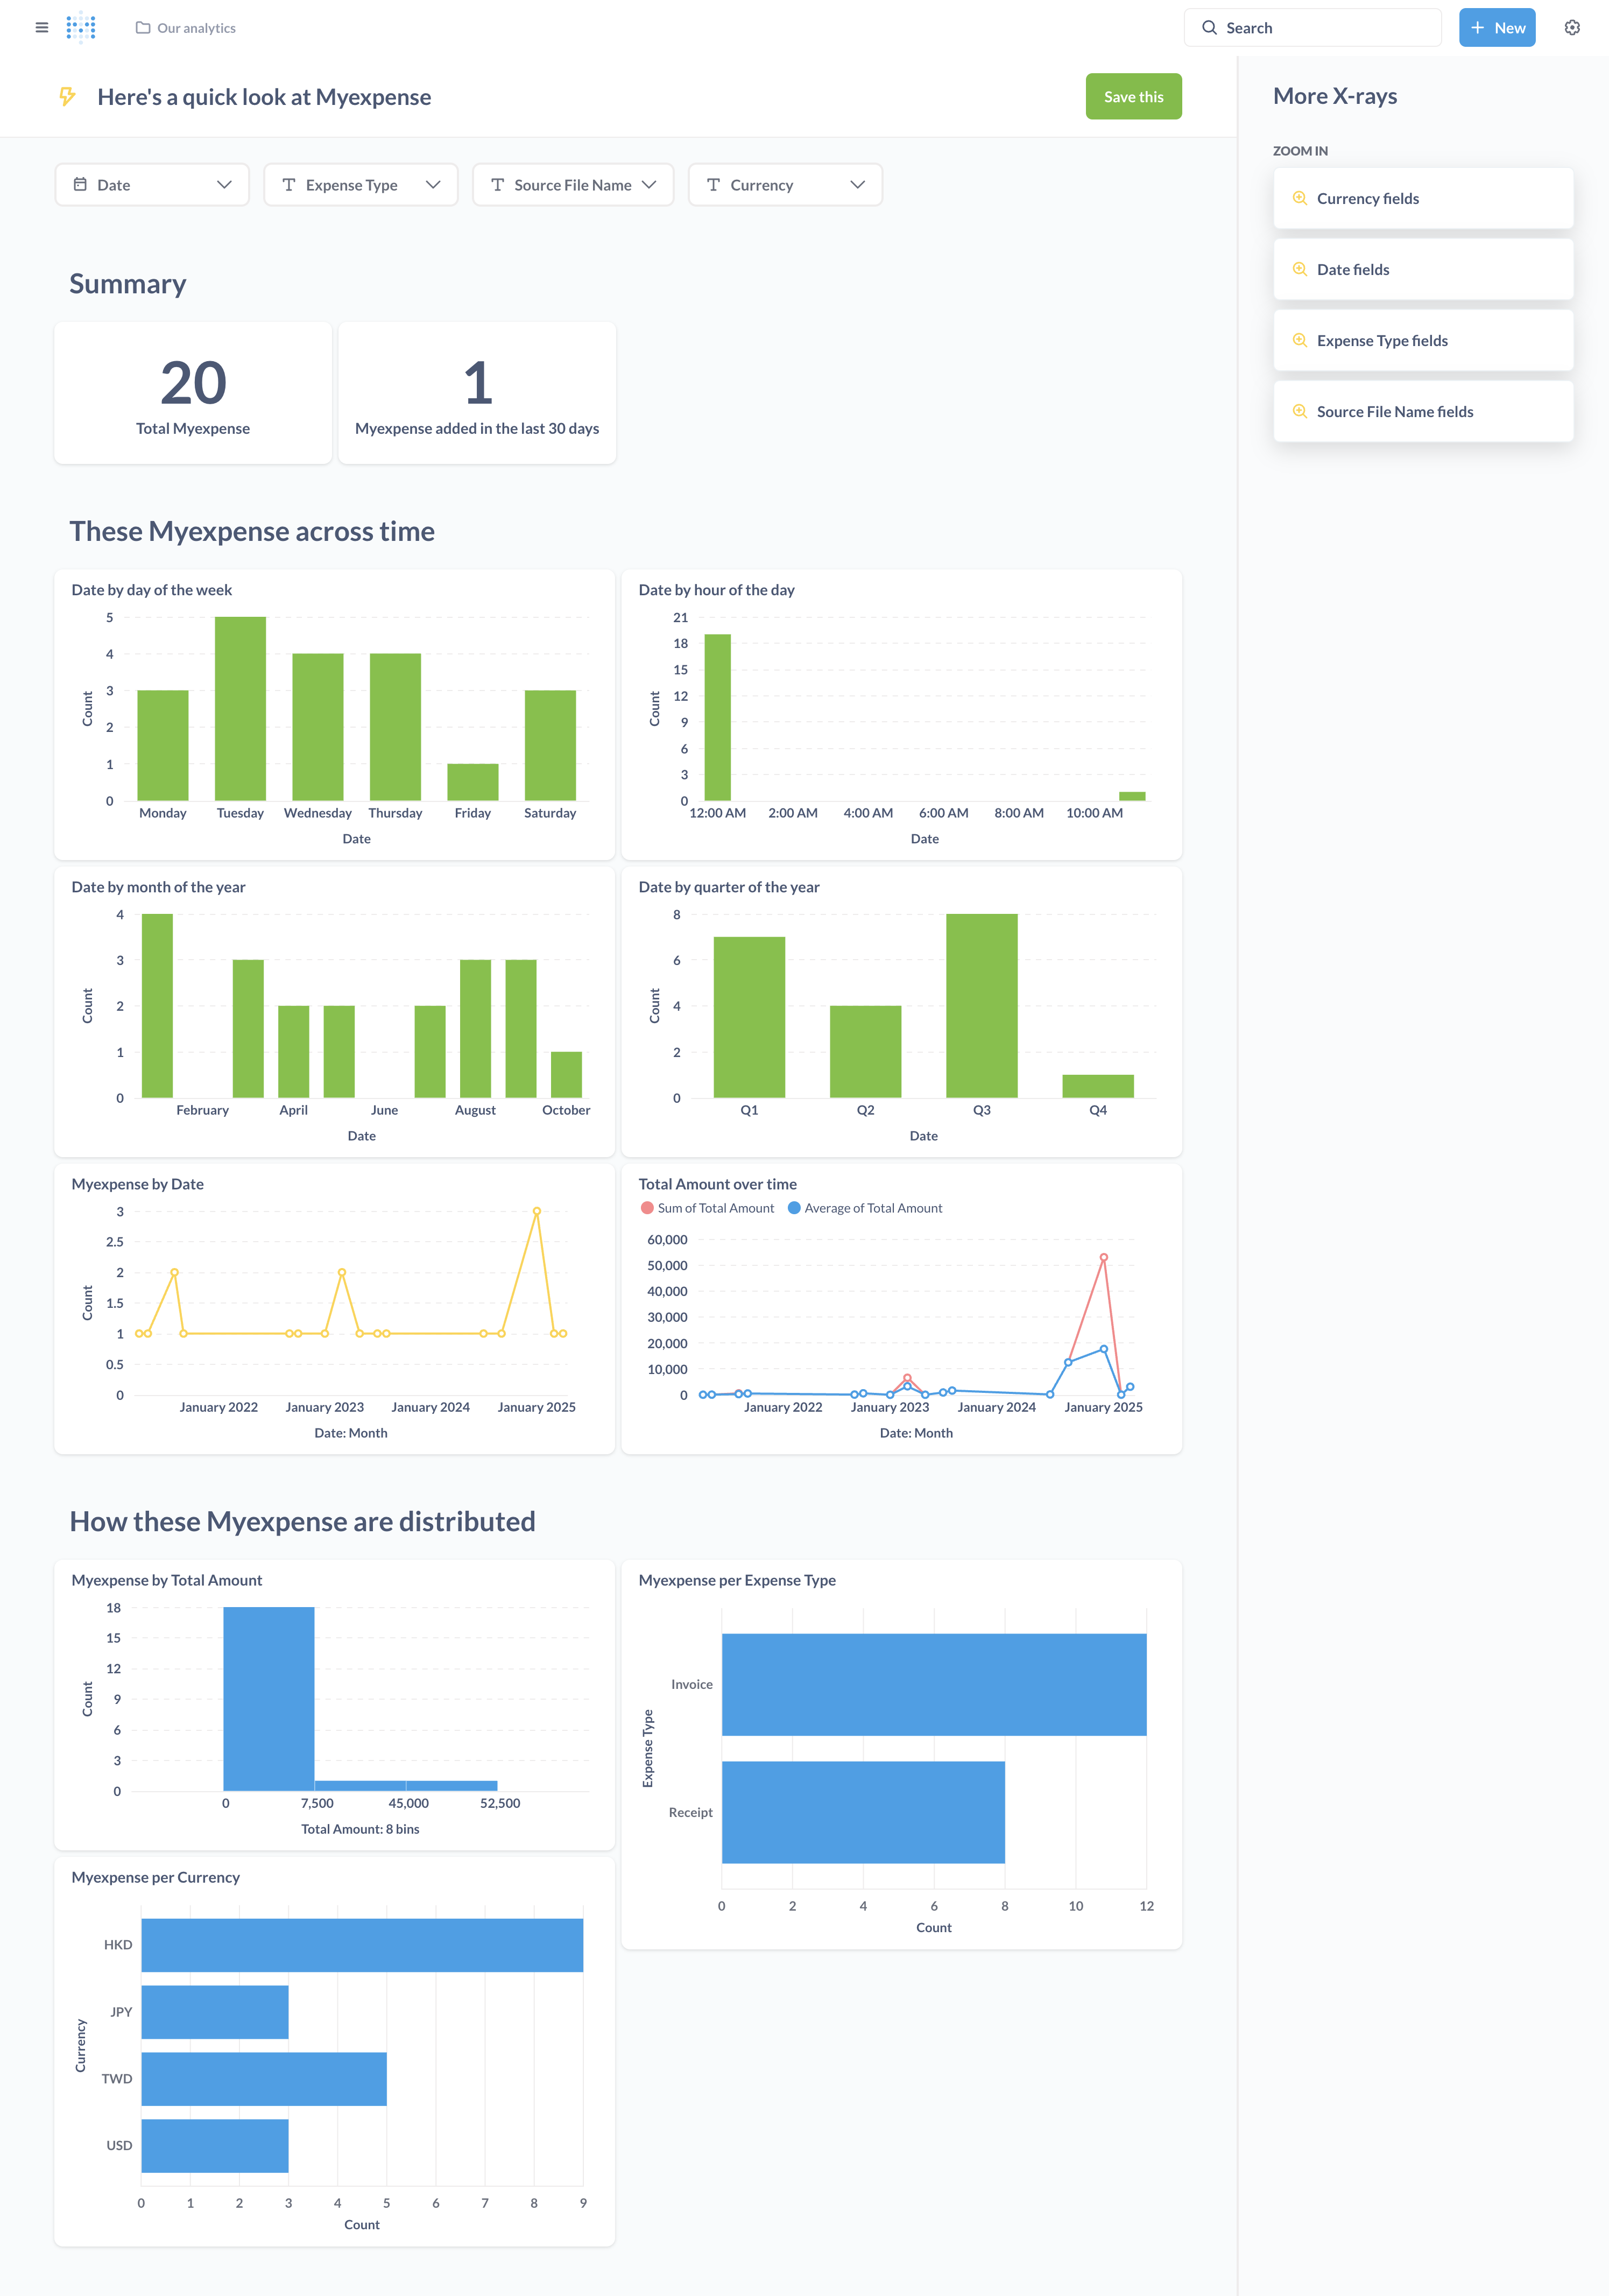
Table of Contents
Introduction
Do you have a bunch of receipts (or invoice, demand-notes, etc.) from various sources (e.g. photo of paper receipts, screen cap from PDF, email, etc.) and want to perform the following analytical activities?
- Have a tool that can extract the data from all kinds of expense images and infer the expense category for you
- Your receipts contains multi-language contents (e.g. Chinese, Japanese, etc.), and various currencies
- Save those data into a database for exploration and analytics
- Group the expenses by various criterias (e.g. month, expense category, currency, etc.) and visualize it with charts
If the above is what you want to do, then this tutorial is for you!
This is a step-by-step tutorial to guide you through the process of extracting data from expense images, persist it into a local database, and analyse it with charts by dynamic criterias.
You need to have the following in order to be able to run through this tutorial:
- A laptop or desktop running MacOS
- Python (3.12 or above)
- Docker (for running Metabase)
- Sqlite DB
This tutorial tries to make the process as simple as possible, and suitable for users with less technical experience.
Overview
This tutorial use the following components for various tasks:
- UnderDoc for extracting data from receipt/invoice/demand-notes images
- SQLite for storing extracted data
- Metabase for expense analytics
Prerequisite
Get an UnderDoc API Key
The key step in this tutorial is to extract the expense information from images into structured data (e.g. shop name, amount, currency, inferred category, etc.) that is suitable for storing into a database for exploration. We will use UnderDoc, which is a cost effective platform (with a free tier) in performing this task. This tool also works well with multi-language images.
Using UnderDoc is simple, just signup at their developer portal and get an API key.
Step 1: Signup
First of all, visit the signup page at UnderDoc Developer Portal
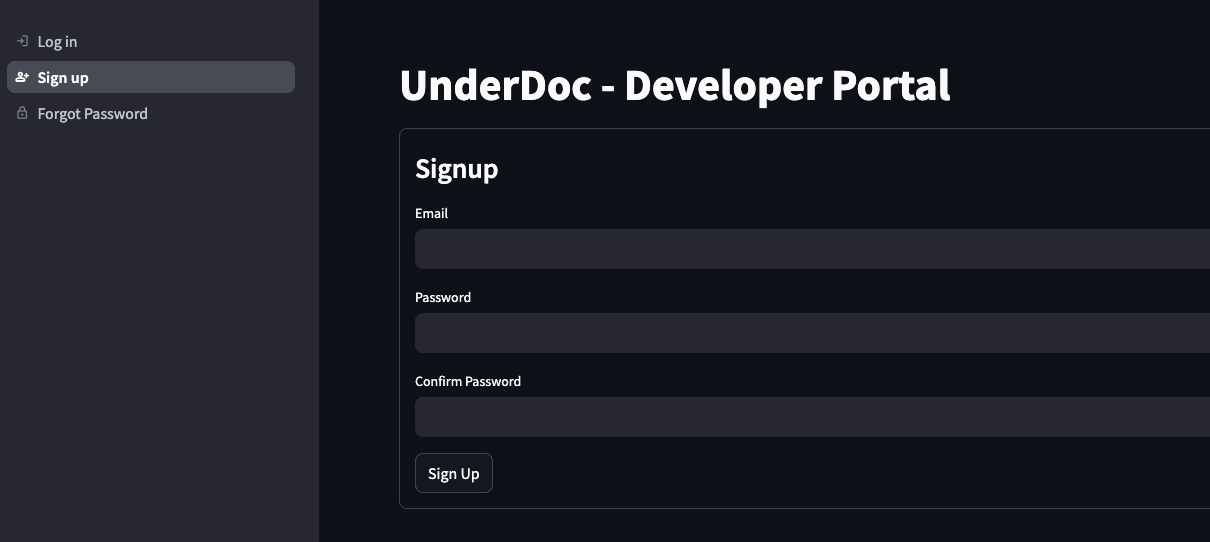
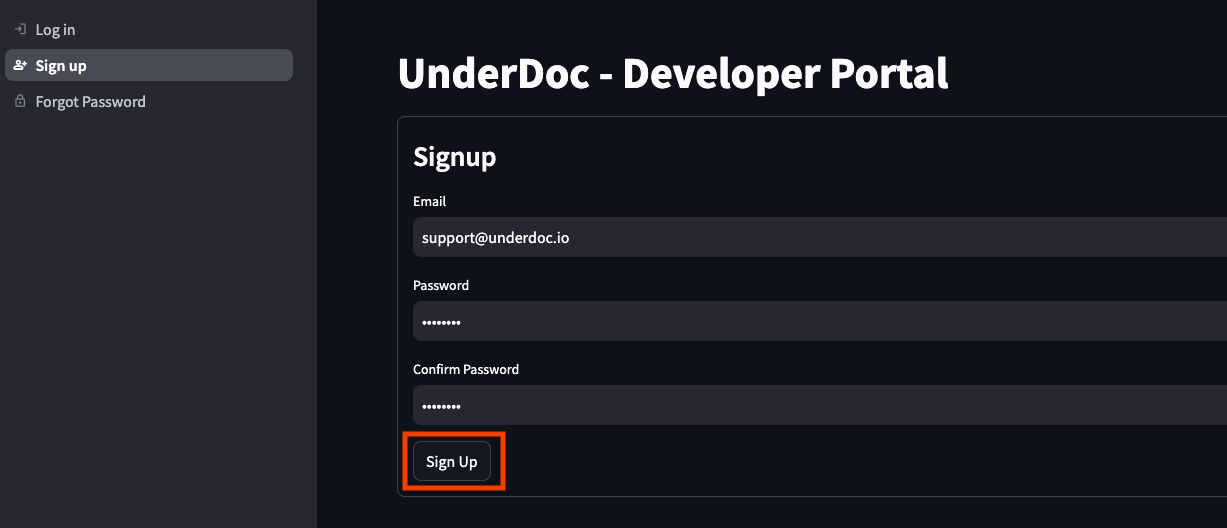
Enter your email, password and then confirm Sign Up.
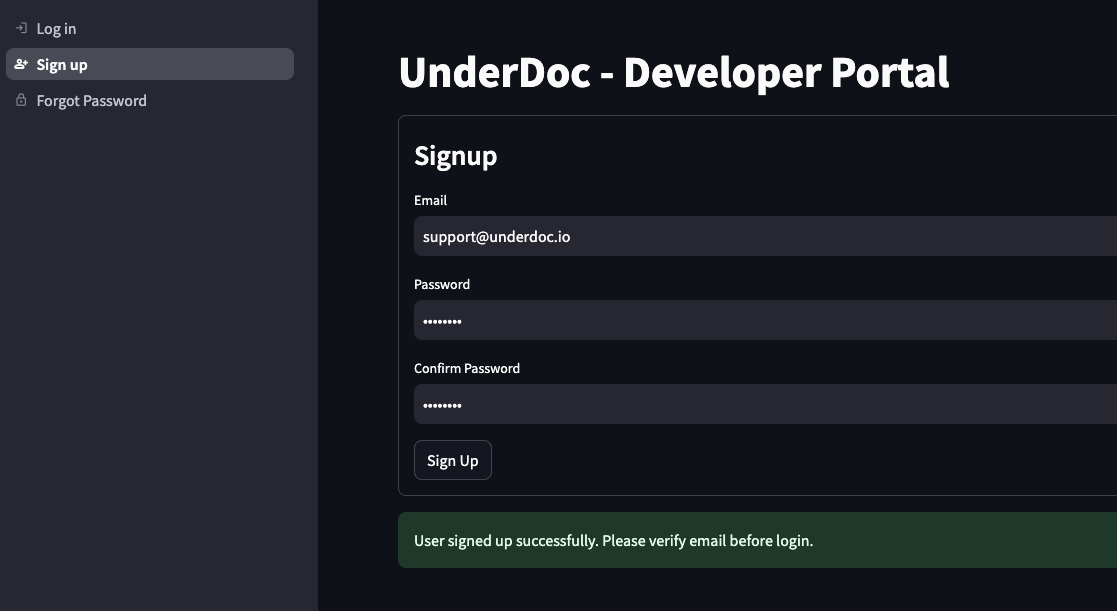
Upon sign up successful, you will receive an email. You need to verify your email before login.
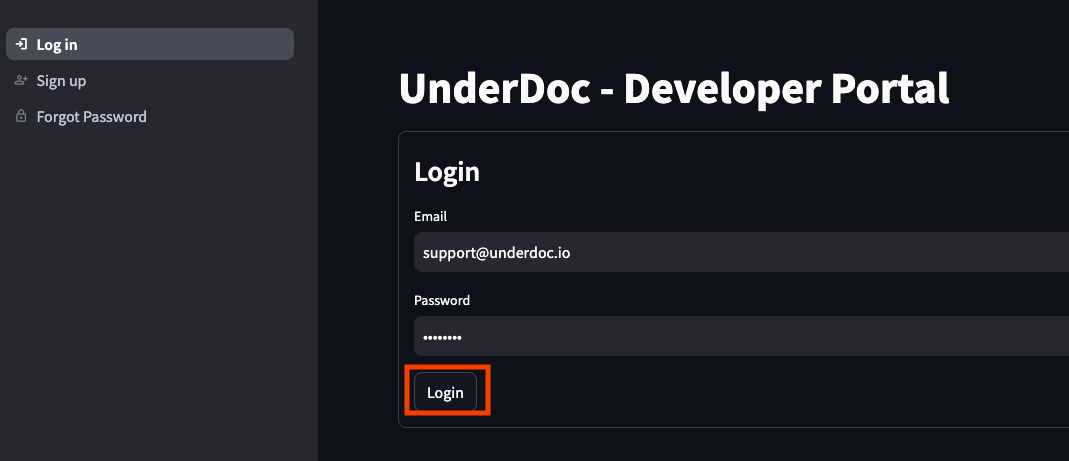
Step 2: Login
Once sign up success and email verified, you can then login to UnderDoc Developer Portal to login.
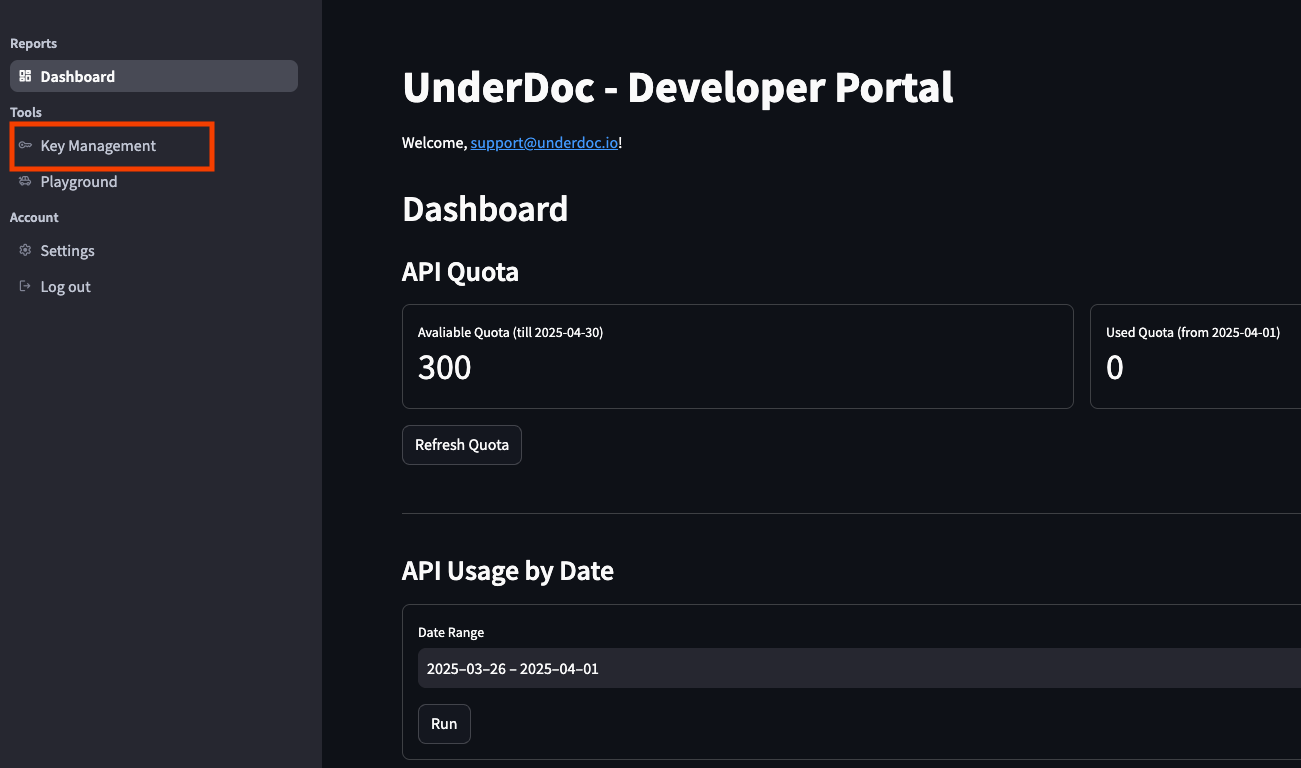
Step 3: Get the key from “Key Management” Page
On the left, select “Key Management”.
In the Key Management page, click the eye icon to display the key, and then copy it for use later in this tutorial.
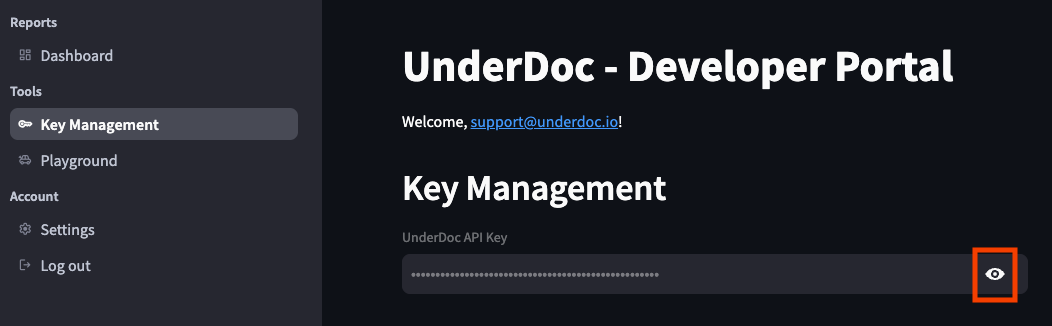
Now you have the UnderDoc API key, and can proceed to the rest of the tutorial.
Install Docker
In this tutorial, we will use Docker to run Metabase, which is a powerful open source data analytics platform. The easiest way to have Docker in your machine is to download Docker Desktop from Docker and install it (free for personal use).
Install Python 3.12
This tutorial was tested with Python 3.12. To install this into your Mac, the easiest way is to install via homebrew. The following is the command.
|
|
Install sqlite command line interface
The expense data extracted will be persisted to SQLite DB locally. We will use SQLite to verify the database as well as the data stored. To install, we also use homebrew.
|
|
This concludes all prerequisites, let’s proceed to environment setup!
Environment Setup
Clone the project for this tutorial
All the Python scripts required, and some sample images were provided by this tutorial. Clone it from GitHub with the following command.
|
|
Once cloned, change directory into the project folder. For example, my folder is as follows:
|
|
In this folder, you will see some folders and files. The following is an overview:
- README.md: this file
- model.py: the Python script for model classes
- main.py: the Python script for the extraction process
- requirements.txt: the Python library packages that this project requires
- receipt-images: the expense images should be put here. You can see 20 sample images provided
- metabase-data: this is where the Metabase and UnderDoc database will be stored
Setup Python Virtual Environment and Install Required Packages
The next step is to create a Python virtual environment for this tutorial and install the required packages. Run the following commands in order.
|
|
Environment Verification
To verify the Python environment, run the following command.
|
|
You should see the list like one below.
|
|
Initialize a SQLite DB (optional)
We need to have an empty SQLite DB file for storing extracted expense data. This repo already provided one (in metabase-data/underdoc.db). If you need to initialize one, run the following command:
|
|
Copy your expense images into the folder receipt-images
The script will process all images in the folder receipt-images. You can use the sample images provide, or copy your own images into the folder for analysis,.
If you follow this tutorial so far, I really want to express my sincere thanks! We are now ready for extracting the data from images into the DB.
Perform Data Extraction and Save to DB
Before running the script, setup the environment variable of your UnderDoc API key, as the script will use the key to interact with UnderDoc.
|
|
Once you got the environment setup and ready, extract data to DB is easy. Just run the following command:
|
|
The script make use of the UnderDoc Python SDK to interact with UnderDoc’s Document Understanding API, to get the returned structured data, and then store it into SQLite DB. Depends on your laptops hardware, it will also try to run the extraction of multiple images in parallel.
The script will take some time to run. If successful, you will see output similar to the following.
|
|
Data Verification
To verify that the data in SQLite DB, run the following command.
|
|
In the “sqlite>” prompt, type the following command to list the tables.
|
|
You should see a table “myexpense” appear.
|
|
To list the records in the table, type the following command.
|
|
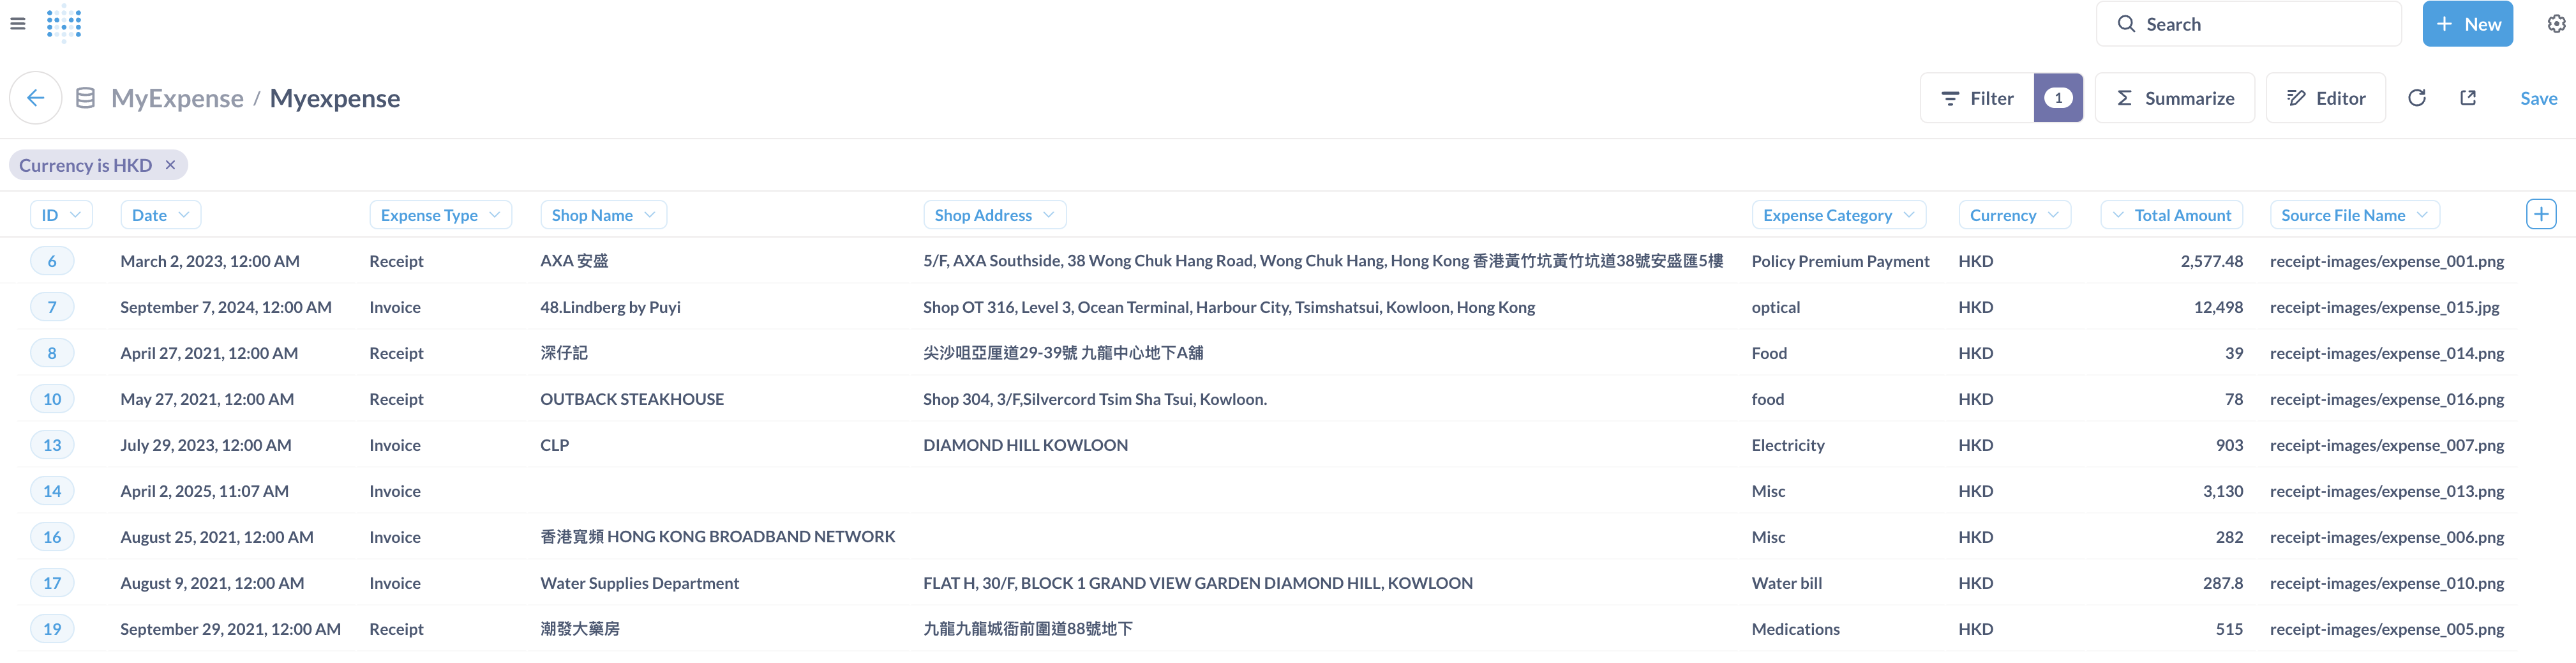
You should be able to see all expense records, similar to the following one.
|
|
As you can see, the sample images provided include English, Chinese and Japanese. You can also see the source image file for each record.
Expense Analytics
Now we have the expense data from our receipt/invoice images extracted and stored in the database, now we can use Metabase to perform analytics.
First of all, we use Docker to run an instance of Metabase.
Run Metabase Docker Container
Verify that you have Docker installed.
|
|
You should see something like below:
|
|
We can then start Metabase with the following command.
|
|
Replace
|
|
Then the command for me is below.
|
|
Let’s breakdown the command into more details:
- Run the container in daemon mode (the -d option)
- Expose the port 3000 from the container (so your browser can connect to Metabase)
- Mount the local folder “~/workspace/underdoc/underdoc-expense-analytics-tutorial/metabase-data” to the container’s folder “metabase-data”, which is Metabase DB folder. By doing this you can retain your Metabase setting when you run your container next time, and also able to access the expense SQLite DB, which is also reside in the folder (the -v option)
- Pass the environment variable MB_DB_FILE, which is used by Metabase to identify the database file location. By default, Metabase use H2 database, and the file will be stored in the /metabase-data sub-folder as well
- Give the container a name “metabase”, so that you can restart it by running “docker start metabase” (the –name option)
- The image to pull from Docker hub is “metabase/metabase”. Docker will pull the image on the first time it runs
You can verify whether the container is running by running the following command.
|
|
You should see something similar to the following.
|
|
You can also refer to the Docker container’s log to see if the container is up and running.
|
|
You should see something similar to below.
|
|
Visit Metabase for the First Time from Web Browser
Open a Web Browser, and visit http://localhost:3000.
You should see the getting start page.
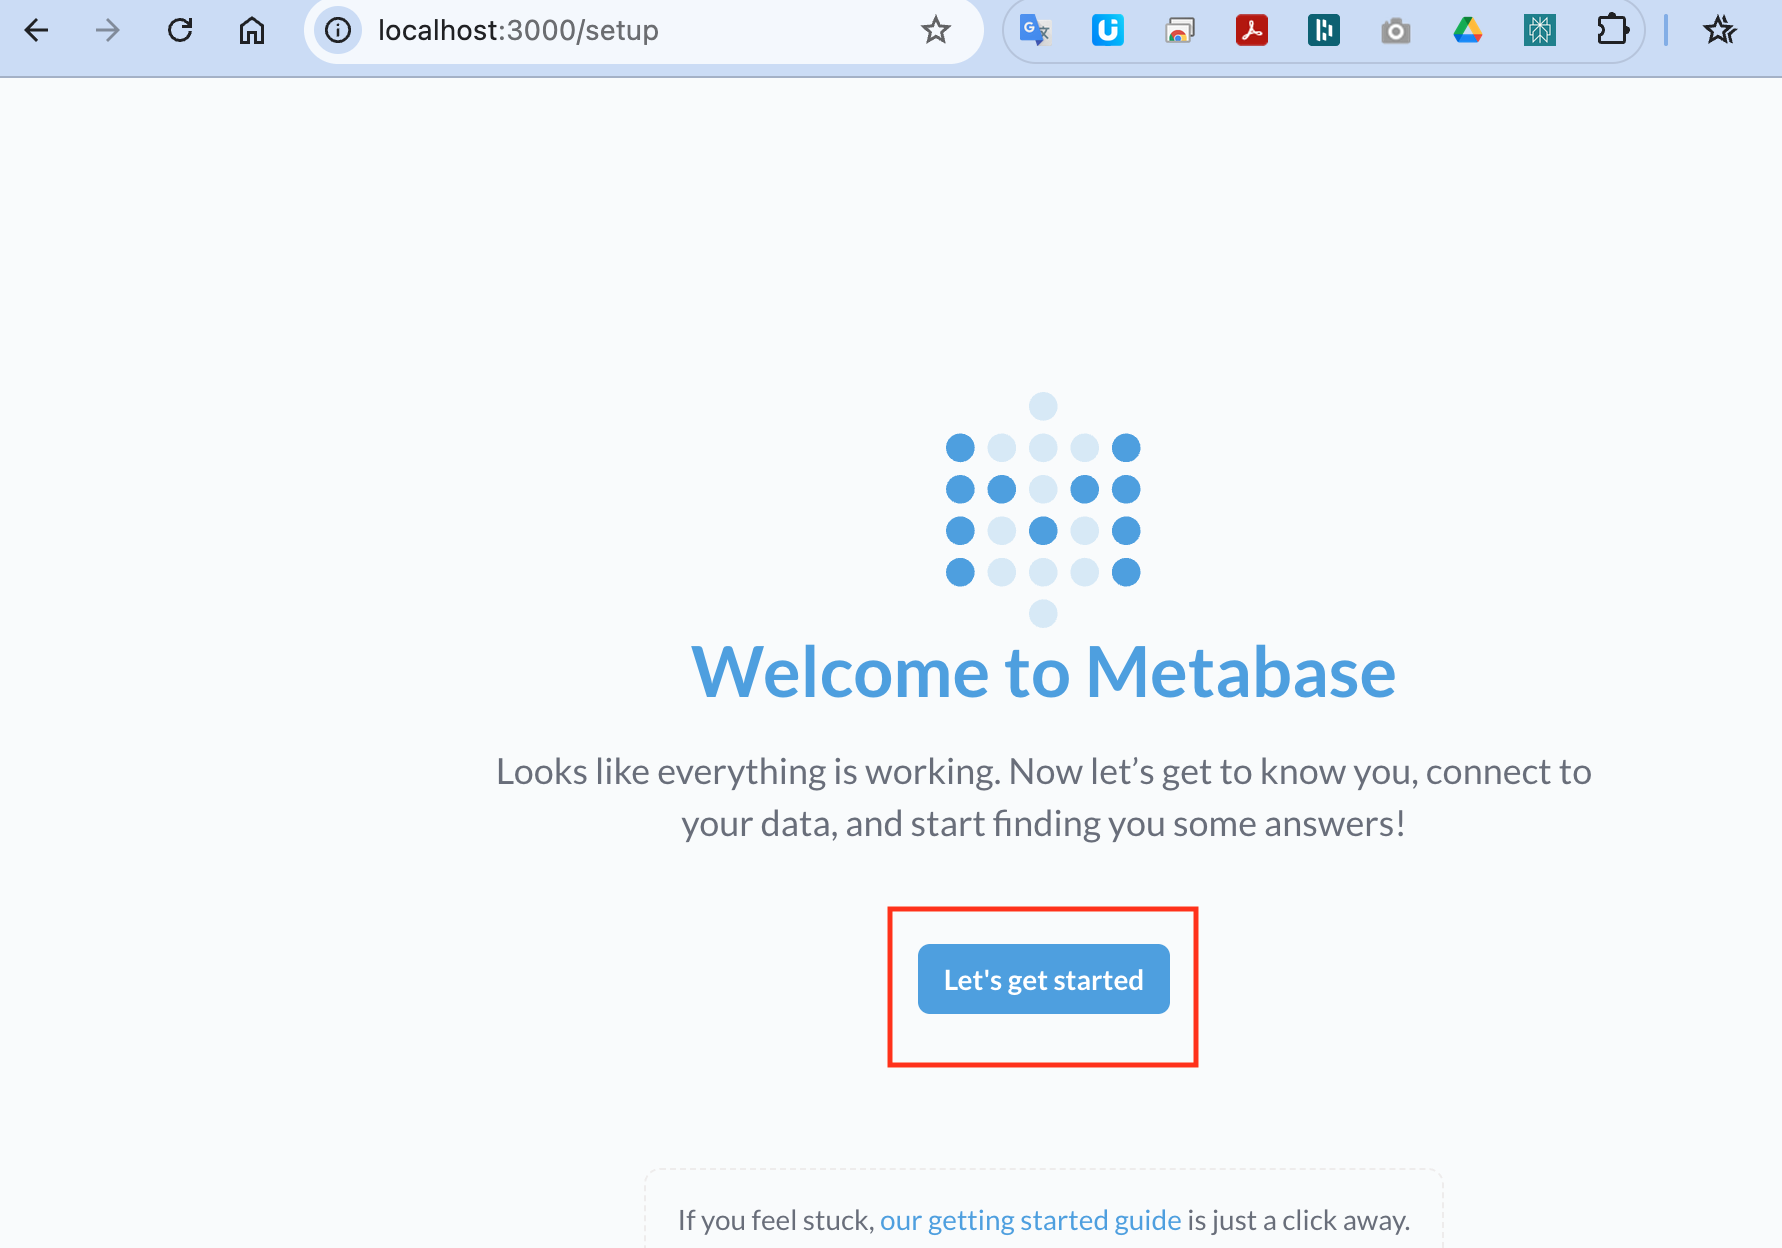
Click “Let’s get started” to proceed to setup Metabase.
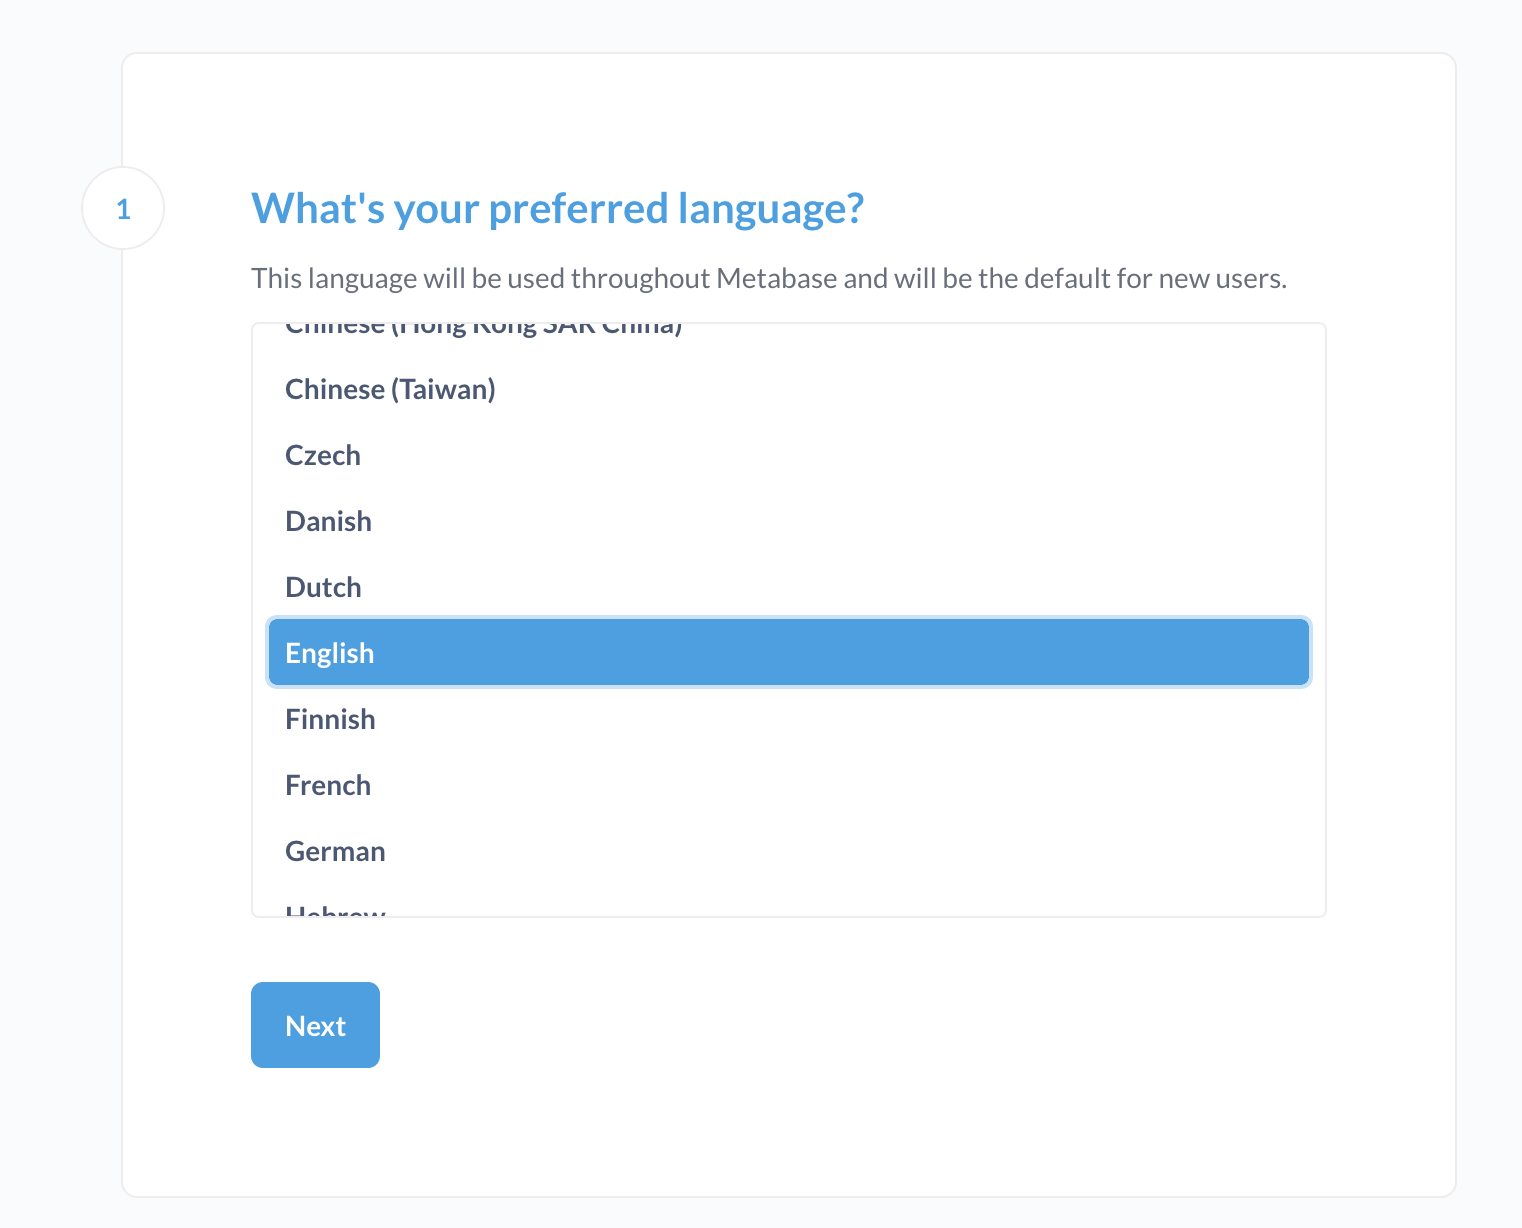
The next page is a few setup questions. The first one is language, choose the one you want and click next.
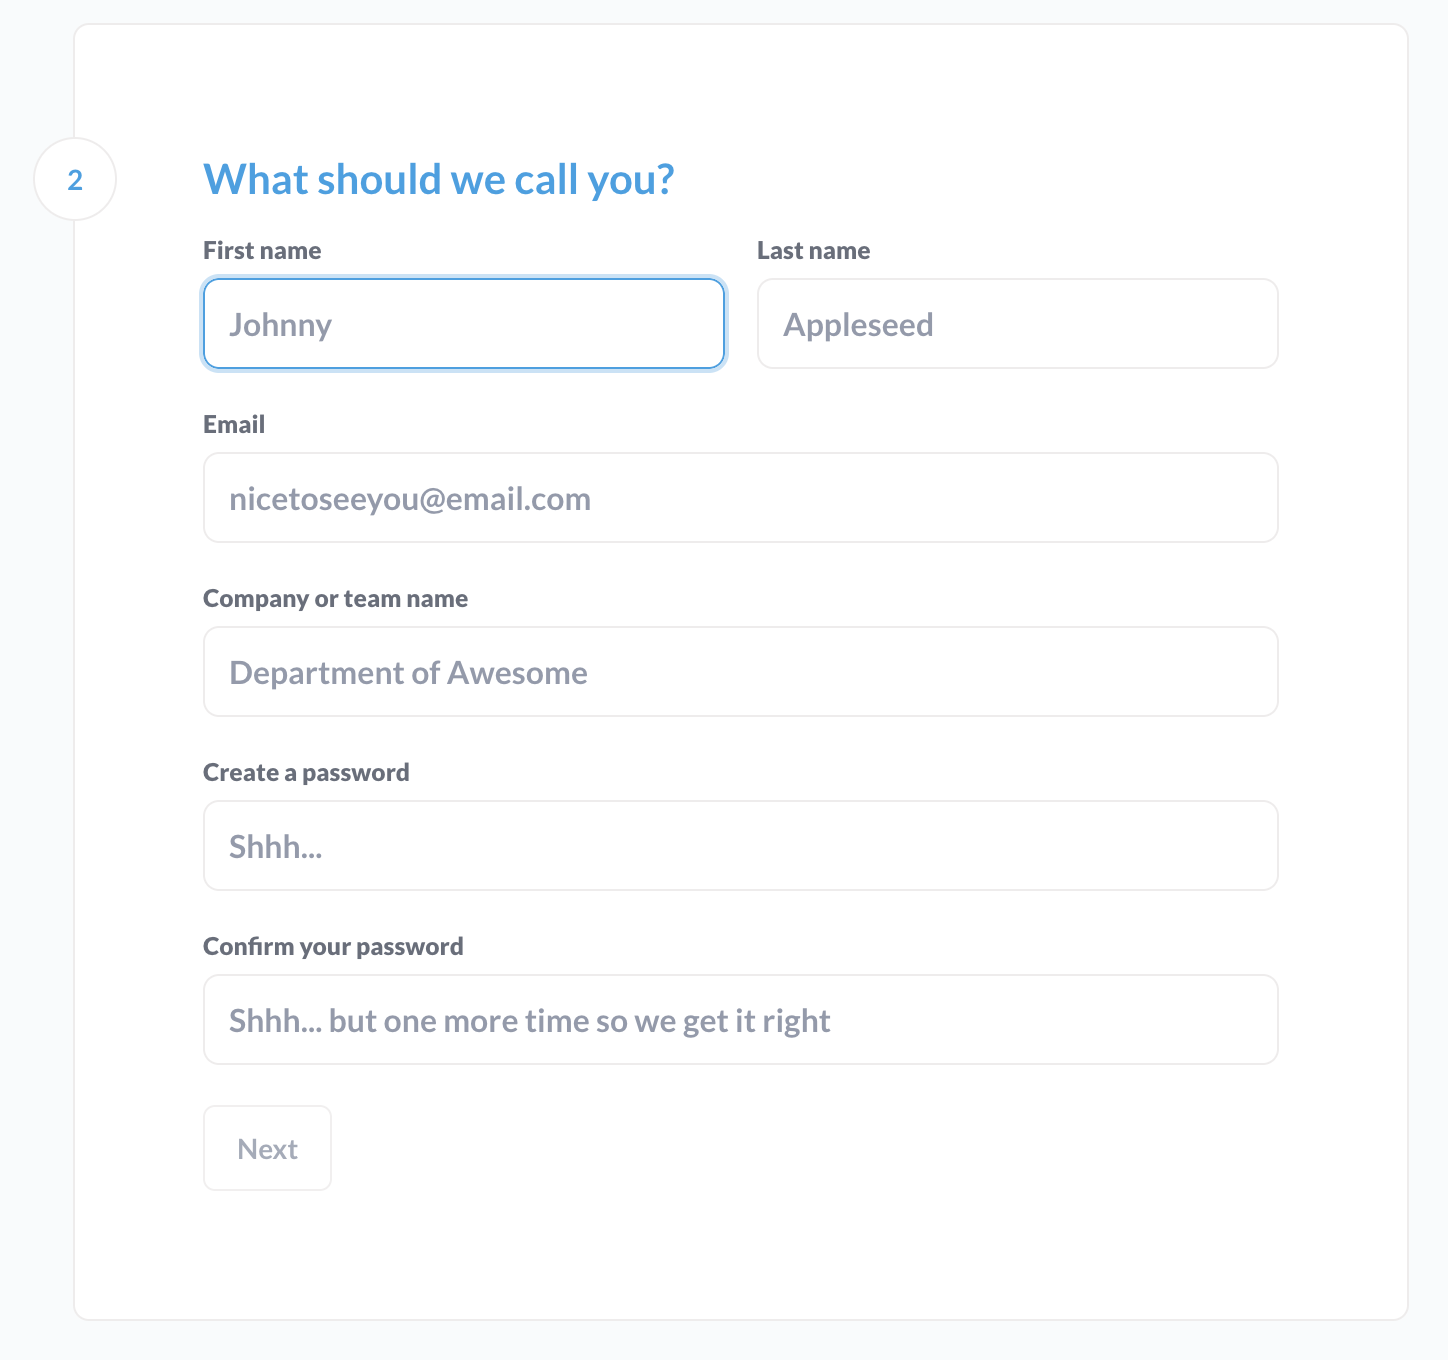
In next page, enter the corresponding information.
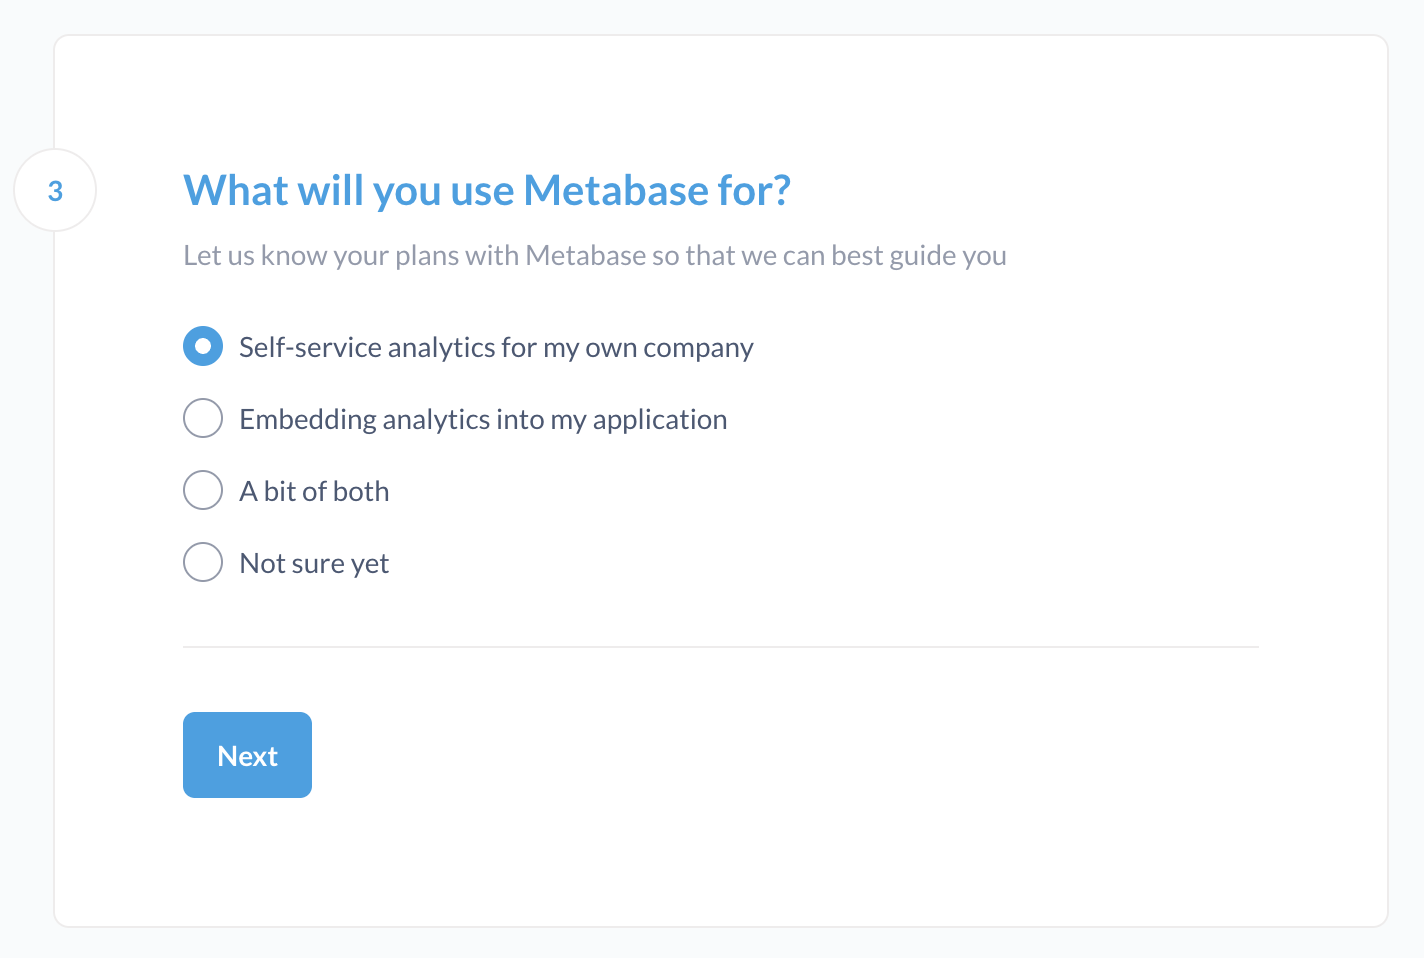
In the next page, choose the option you want.
Connect to UnderDoc SQLite DB
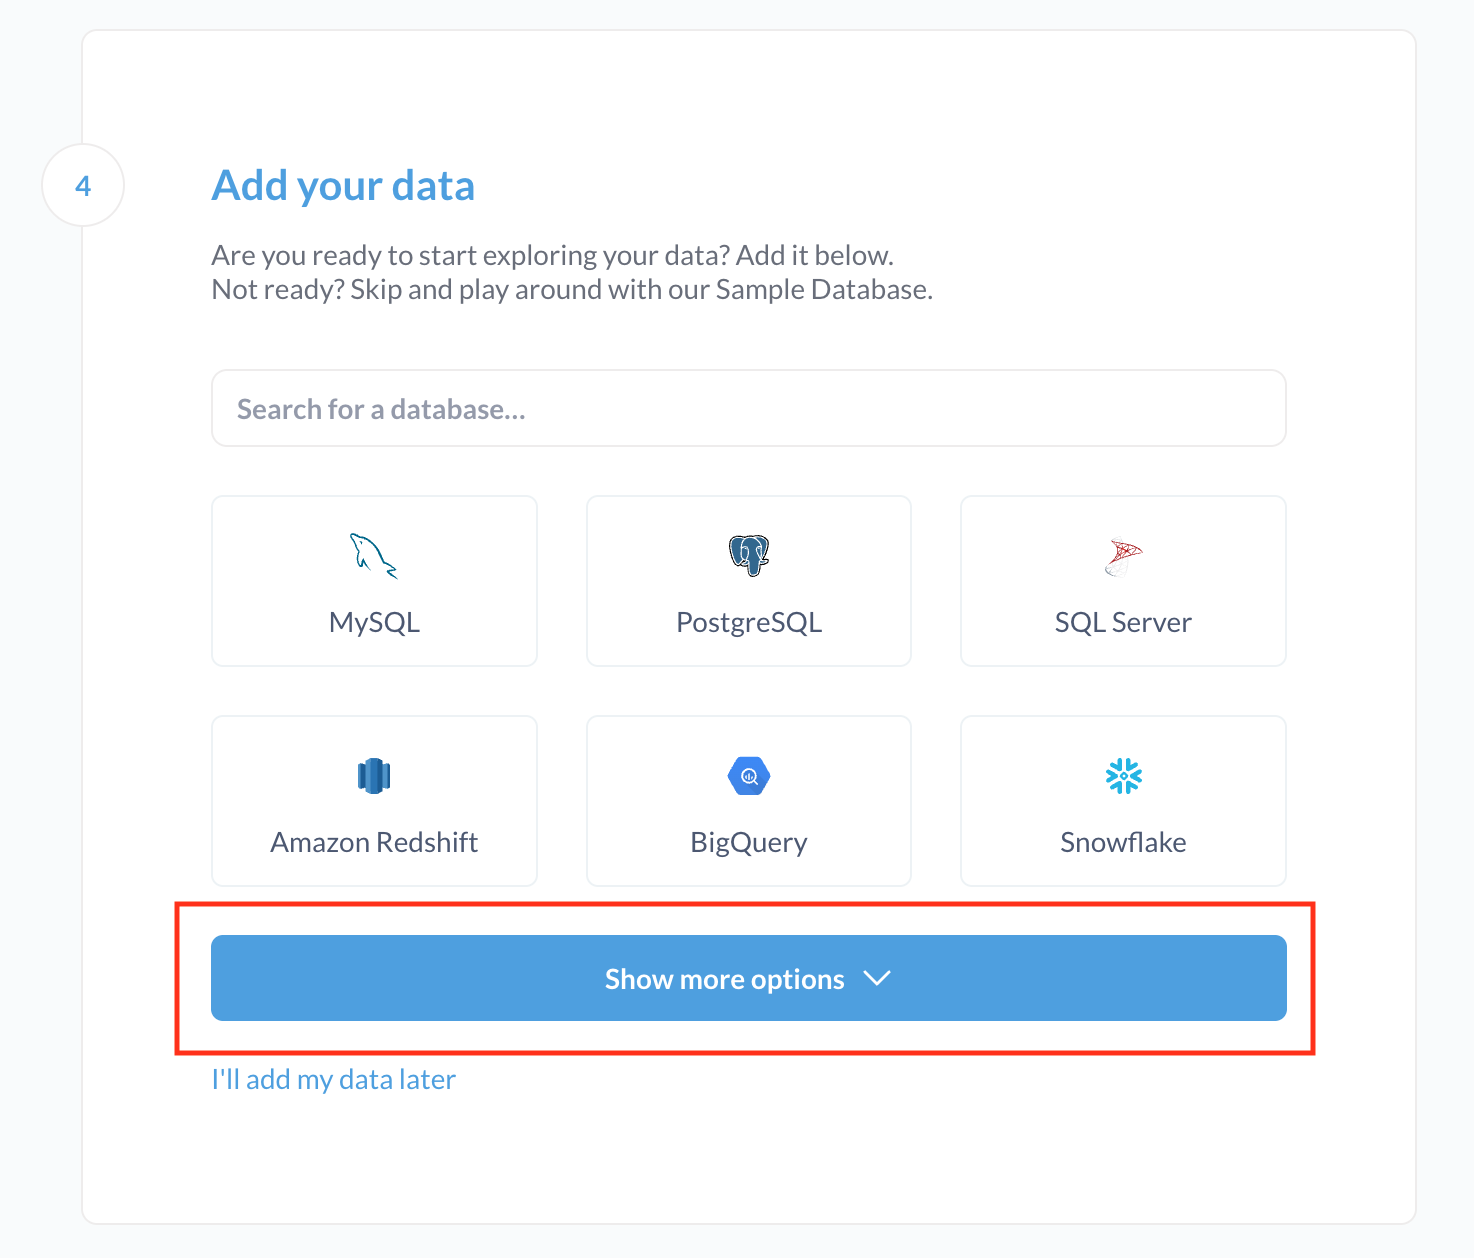
The next step is add data, we can add our expense SQLite DB connection here.
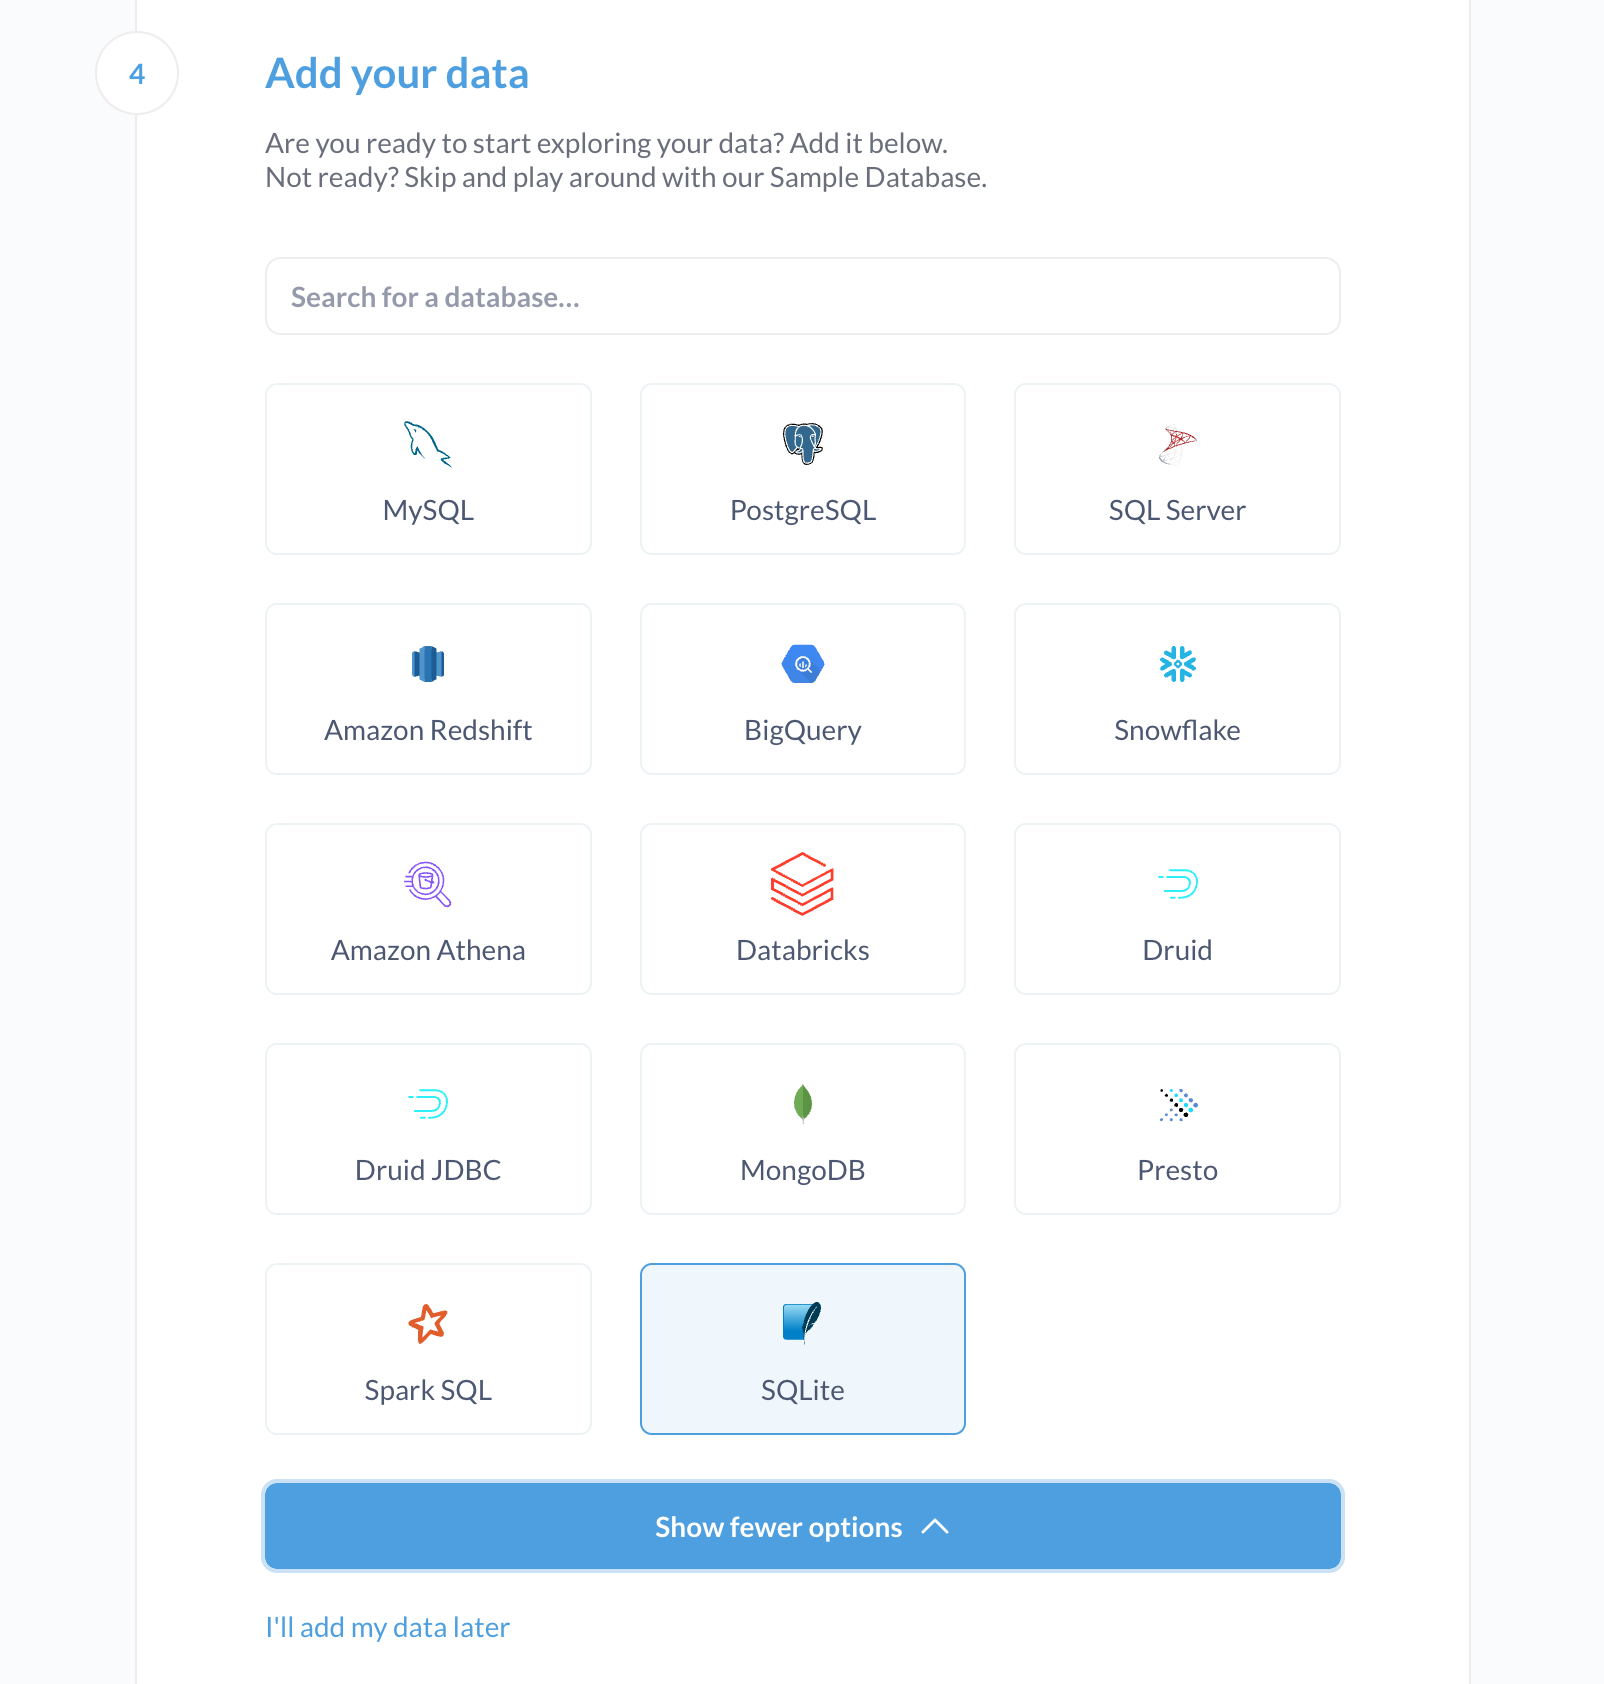
Firstly, click the “Show more options” button to see more database types.
Select the database type “SQLite”.
In the next page, enter the SQLite DB information. For display name, enter “MyExpense”. For filename, enter “/metabase-data/underdoc.db” which is the SQLite DB file we use, and was mounted to the Metabase’s container. The following shows the screen shot.
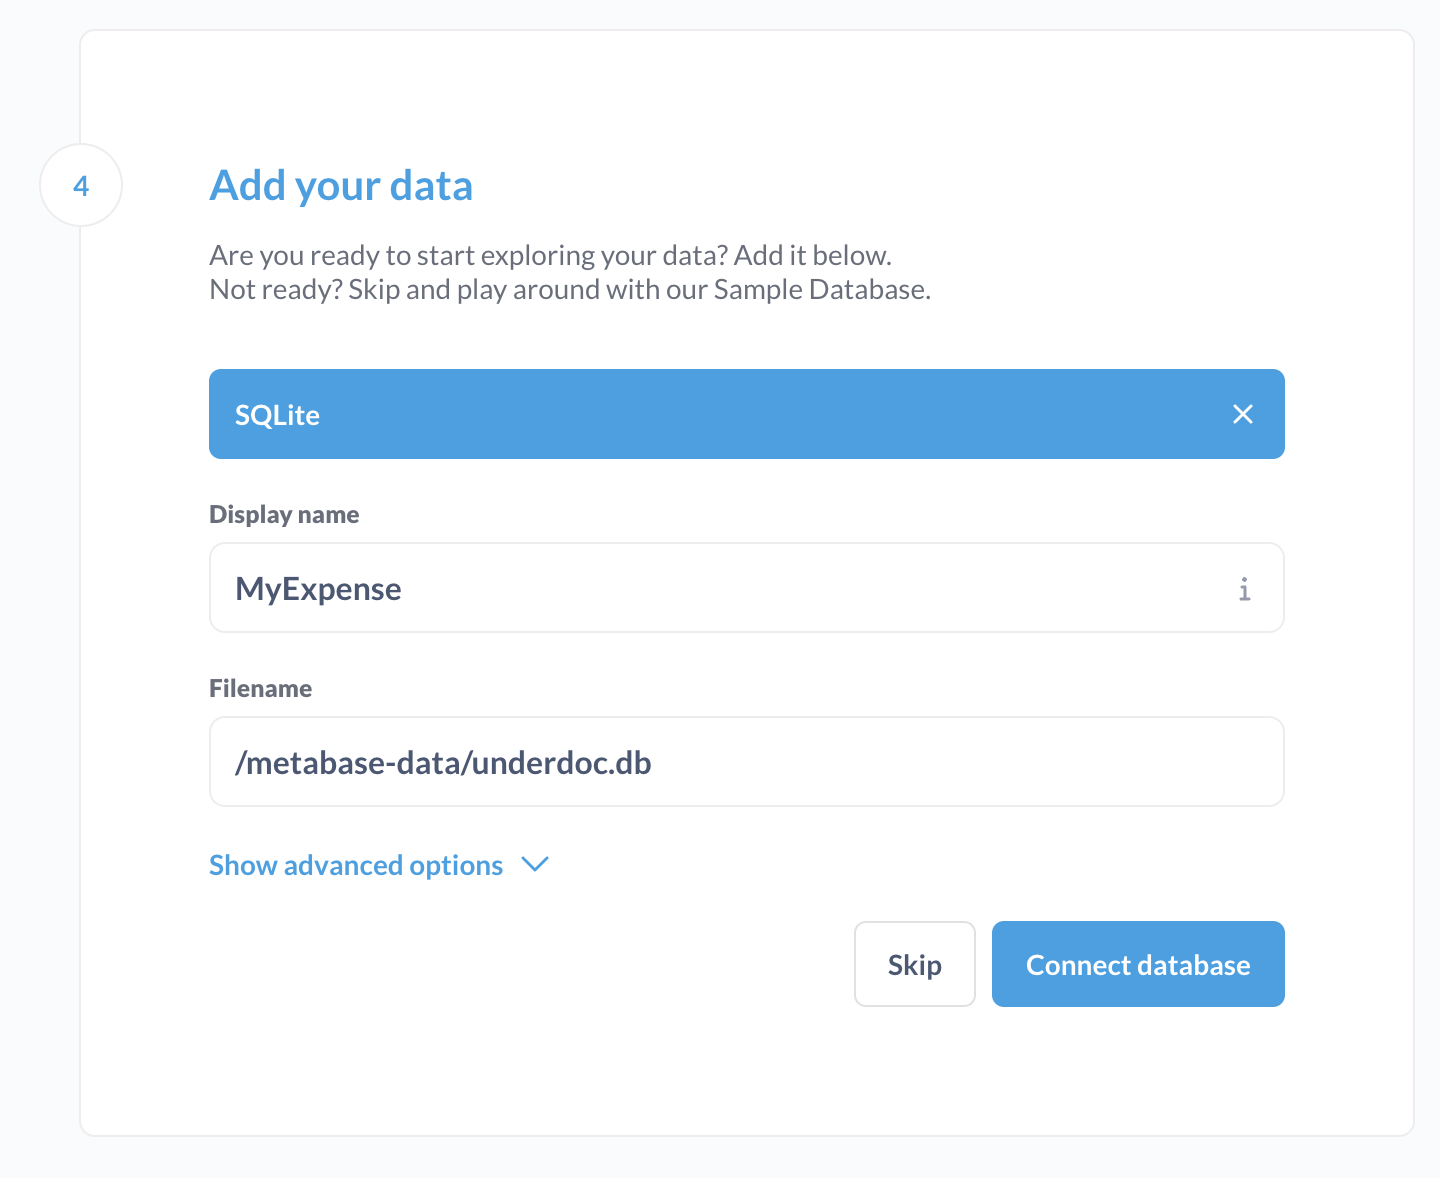
Click “Connect database” to connect.
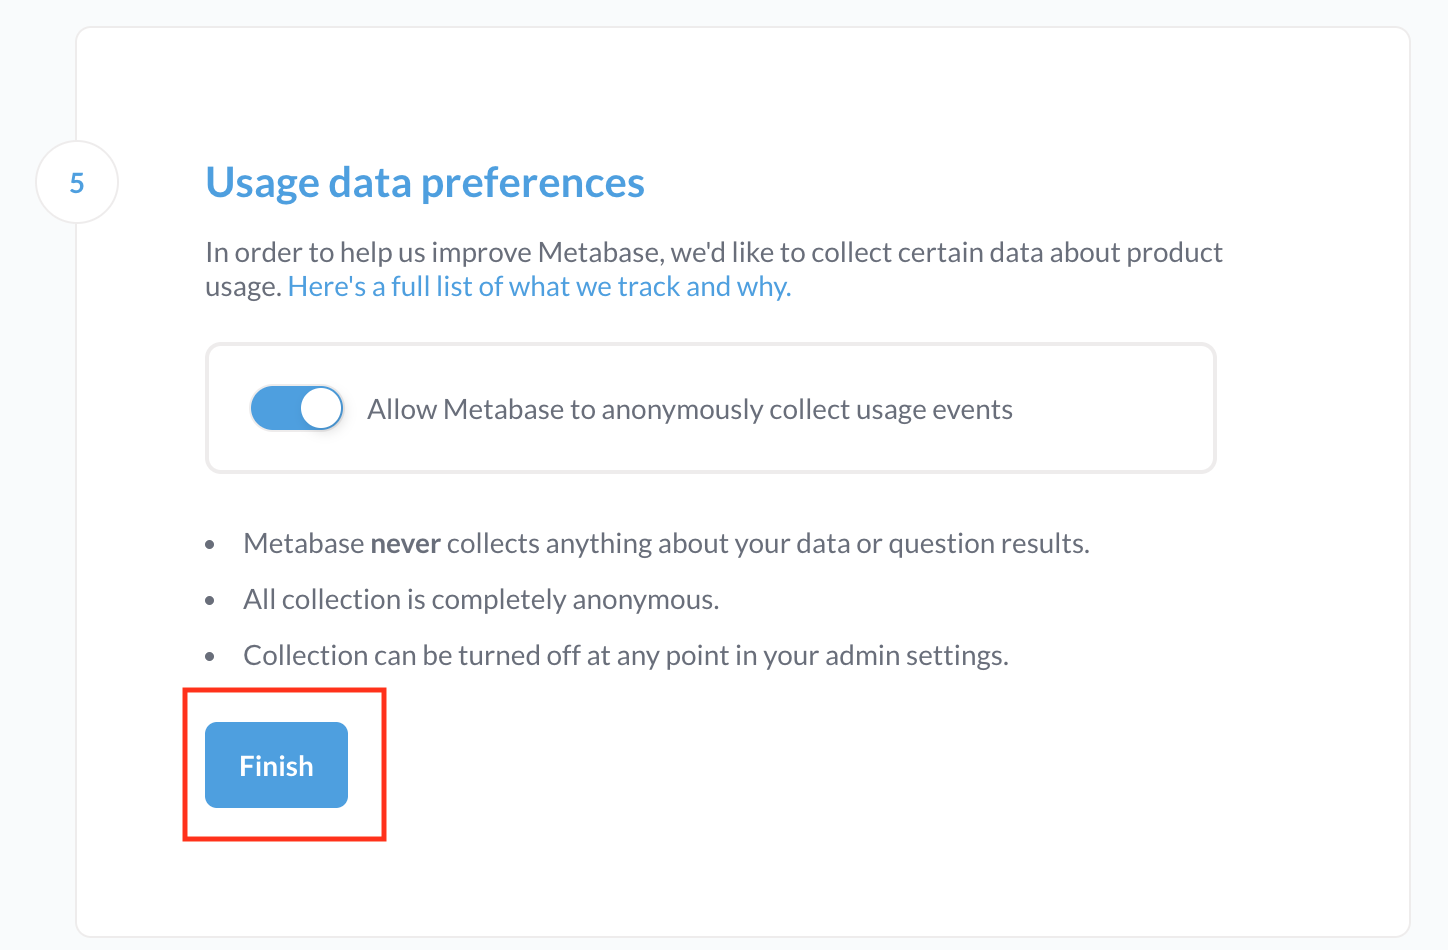
In the last page, click “Finish”.
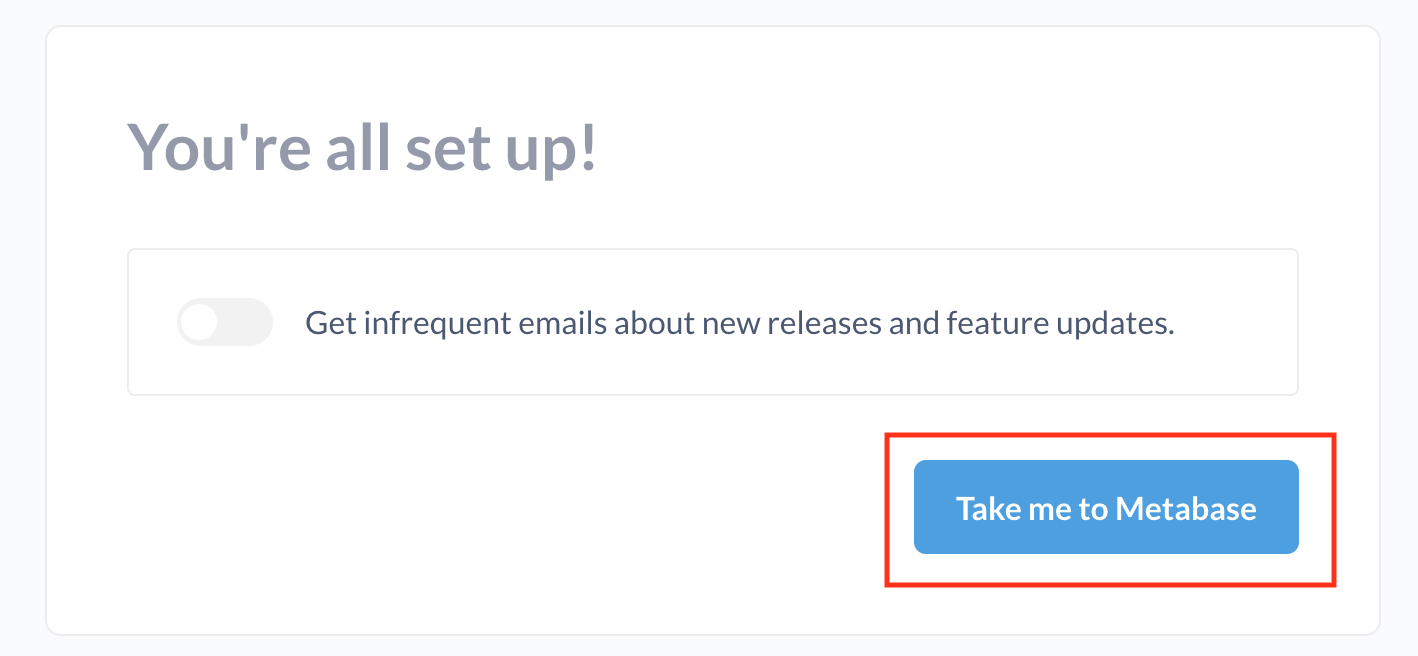
In the last page, click “Take me to Metabase”.
You will then able to see the home page of Metabase, include the “Myexpense” database that contains my expense data.
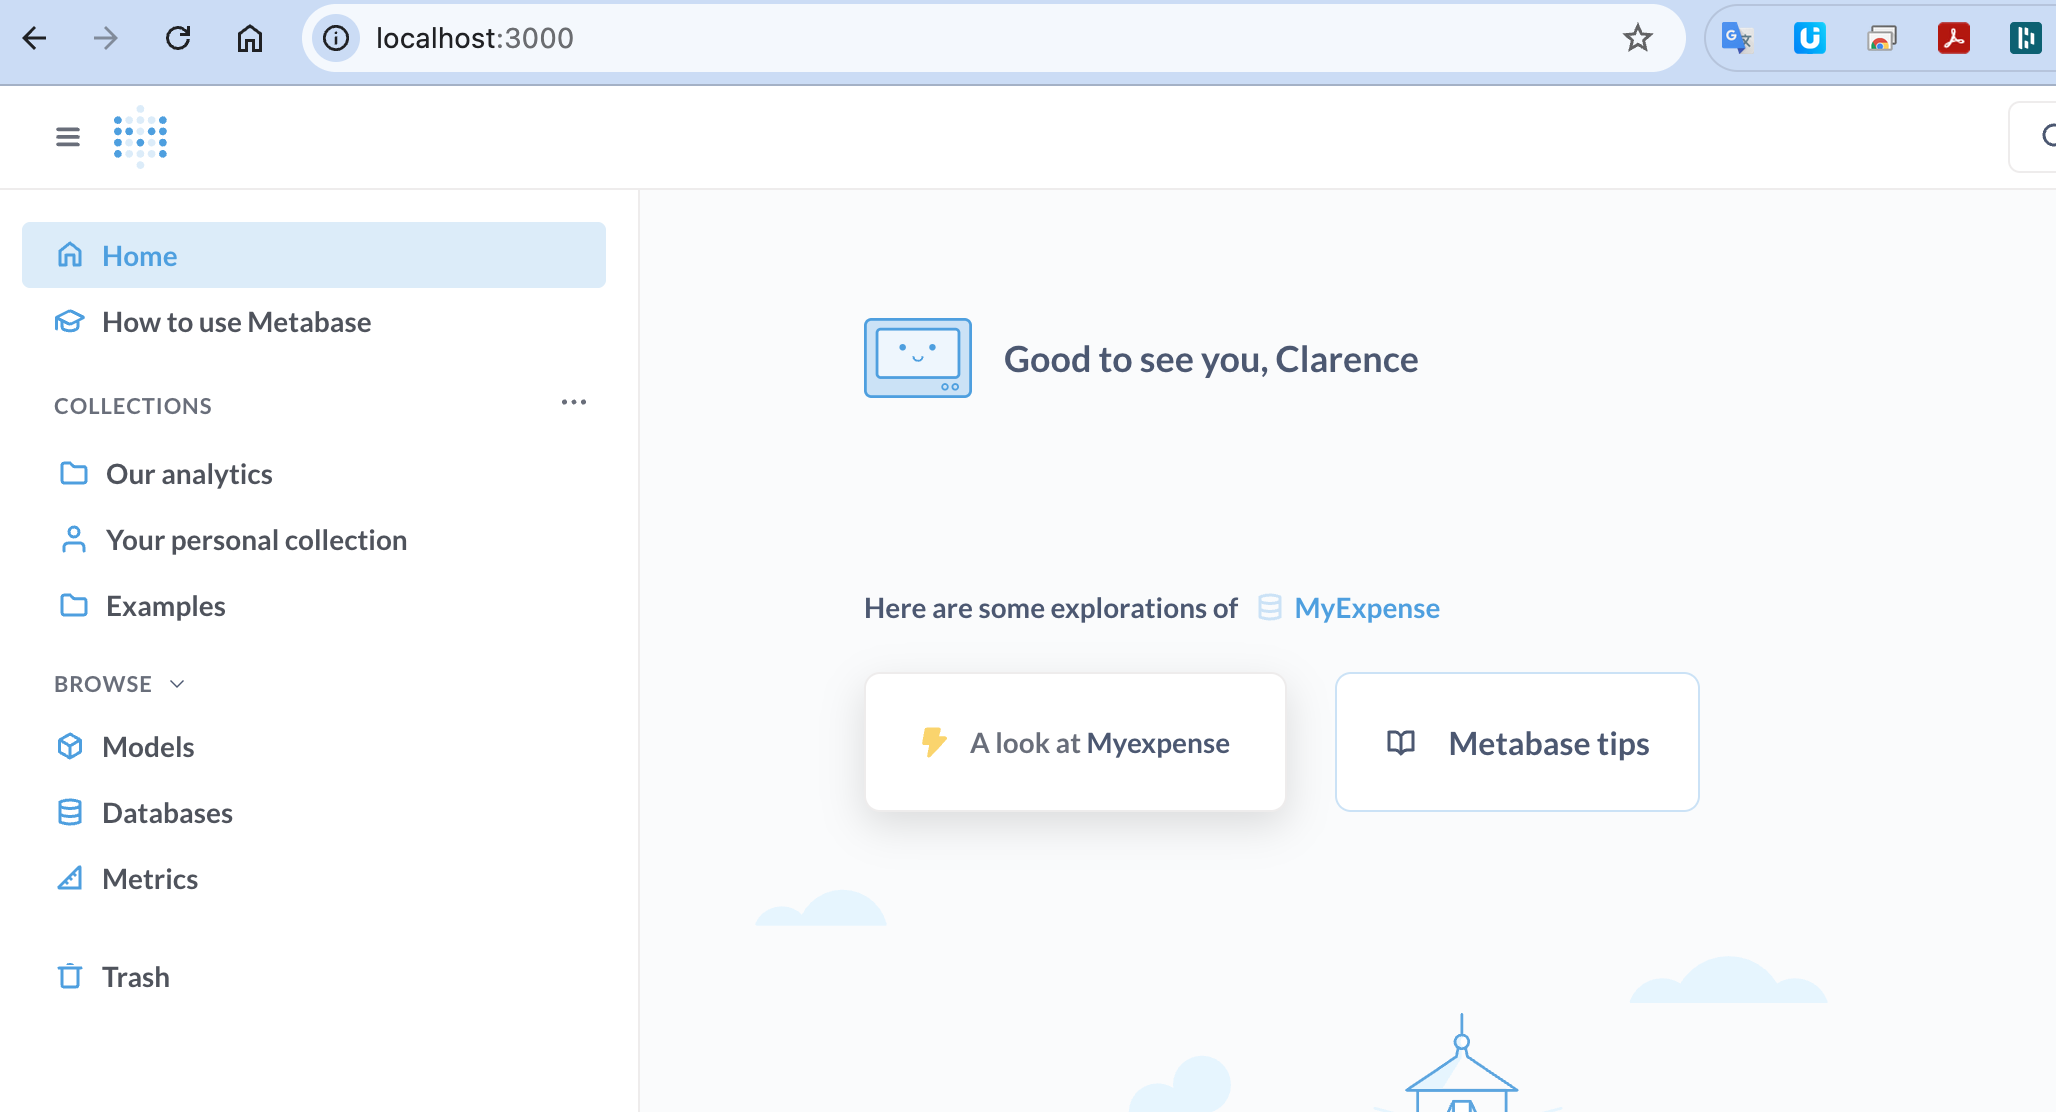
Overview of Expense Data
From the Home page, you will notice a button called “A look at Myexpense”, which is some default explorations provided by Metabase by looking at the database tables and schema. When you click into it. You will be able to see some default metrics presented in various cards and charts.
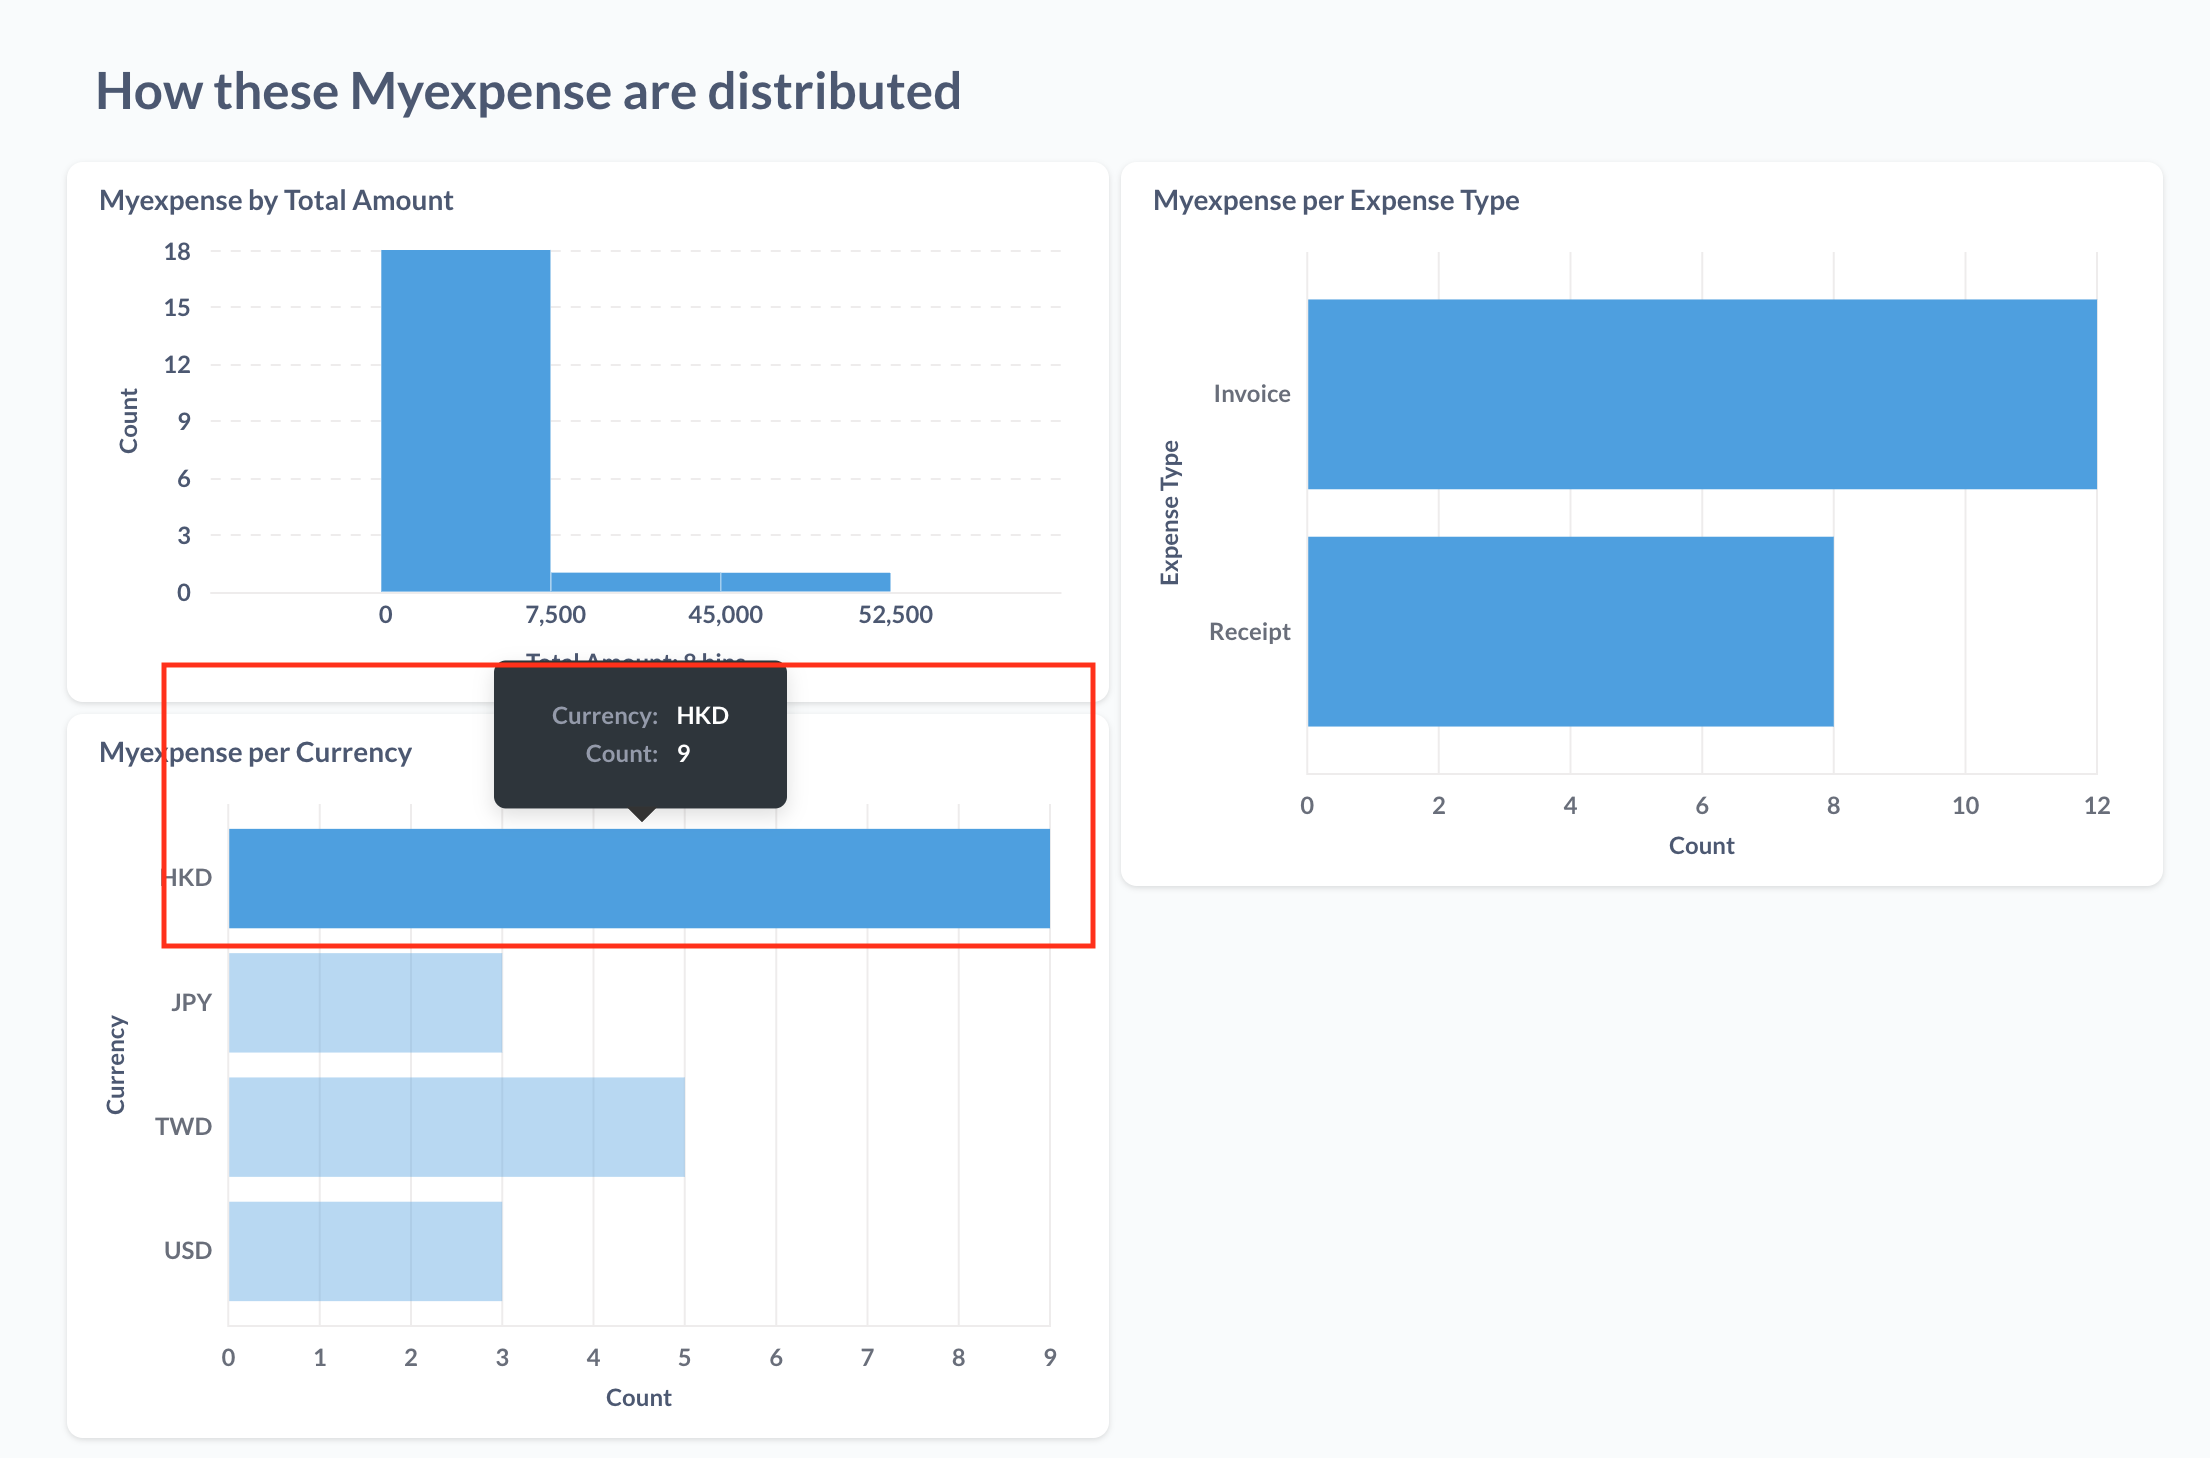
For example, count of expenses by various date time criteria (day of week, month of year, quarter of year, date), and total amount over time, etc.
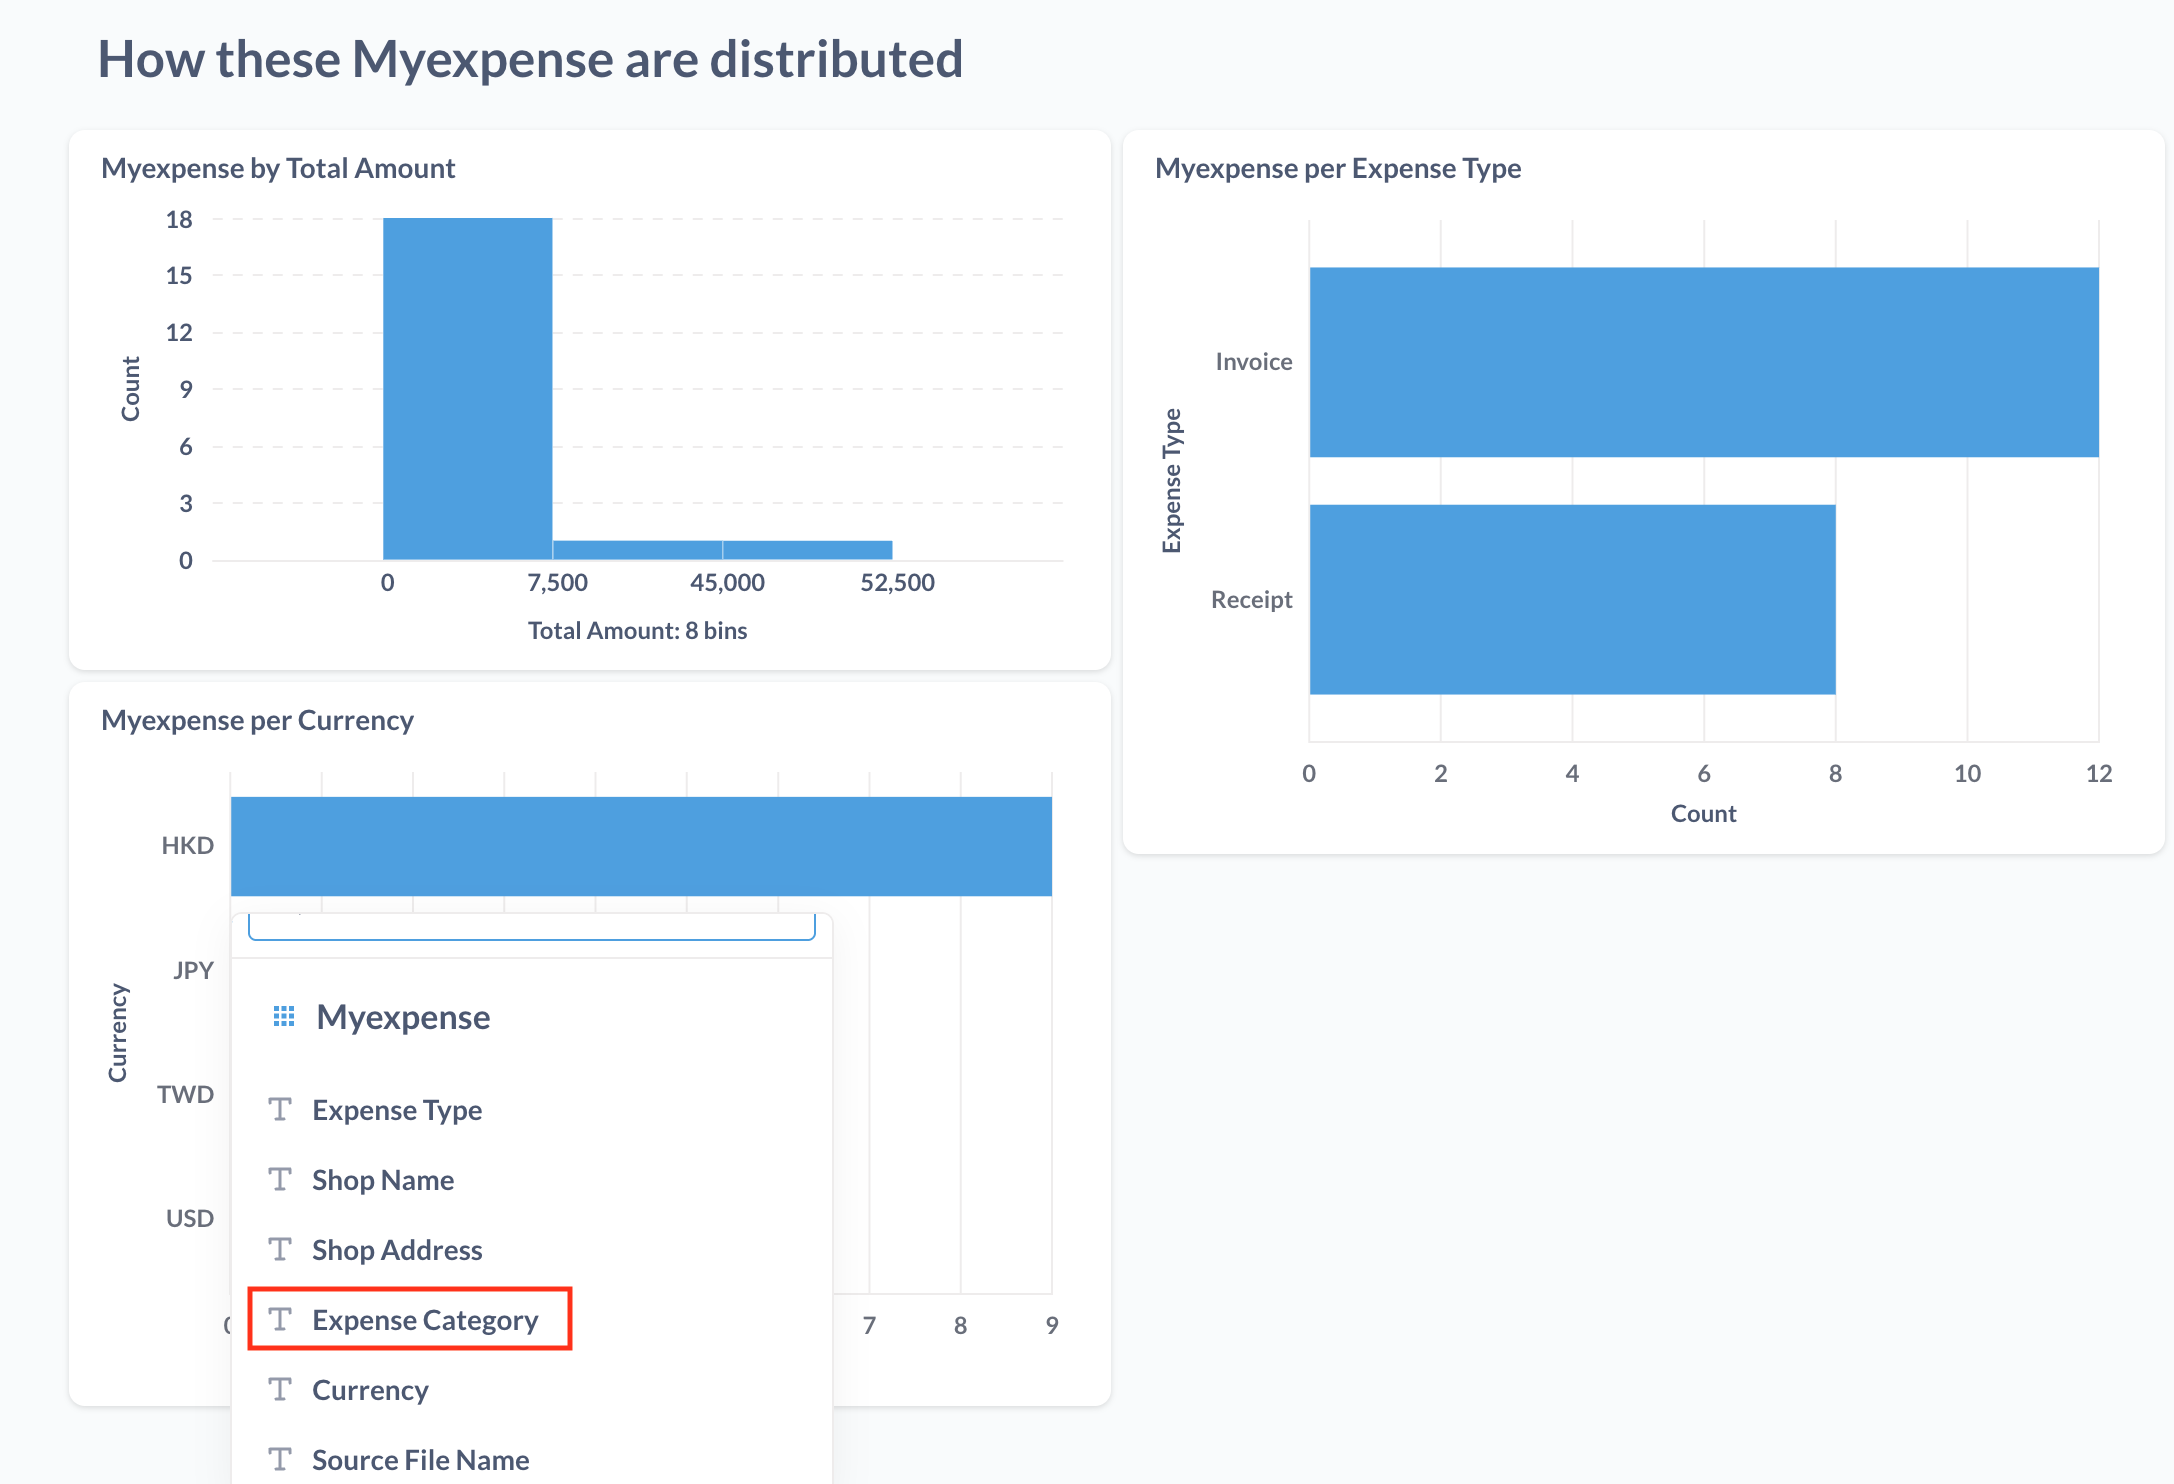
In the lower part of the page, you will see charts with various grouping criteria. Those including amount range, image type (receipt/invoice), and currency, etc.

Expense Analytics like a Pro
Metabase is a powerful tools that enables you to perform many forms of grouping, filtering and drill down.
For example, I would like to view my expense distribution among various categories, focus in HKD (Hong Kong dollars).
First of all, we can scroll down to the chart “Myexpense per Currency”. Mouse over the bar “HKD”, and you can see there are totally 9 transactions.
Now click onto the bar. A pop-up menu will display, like the one below.
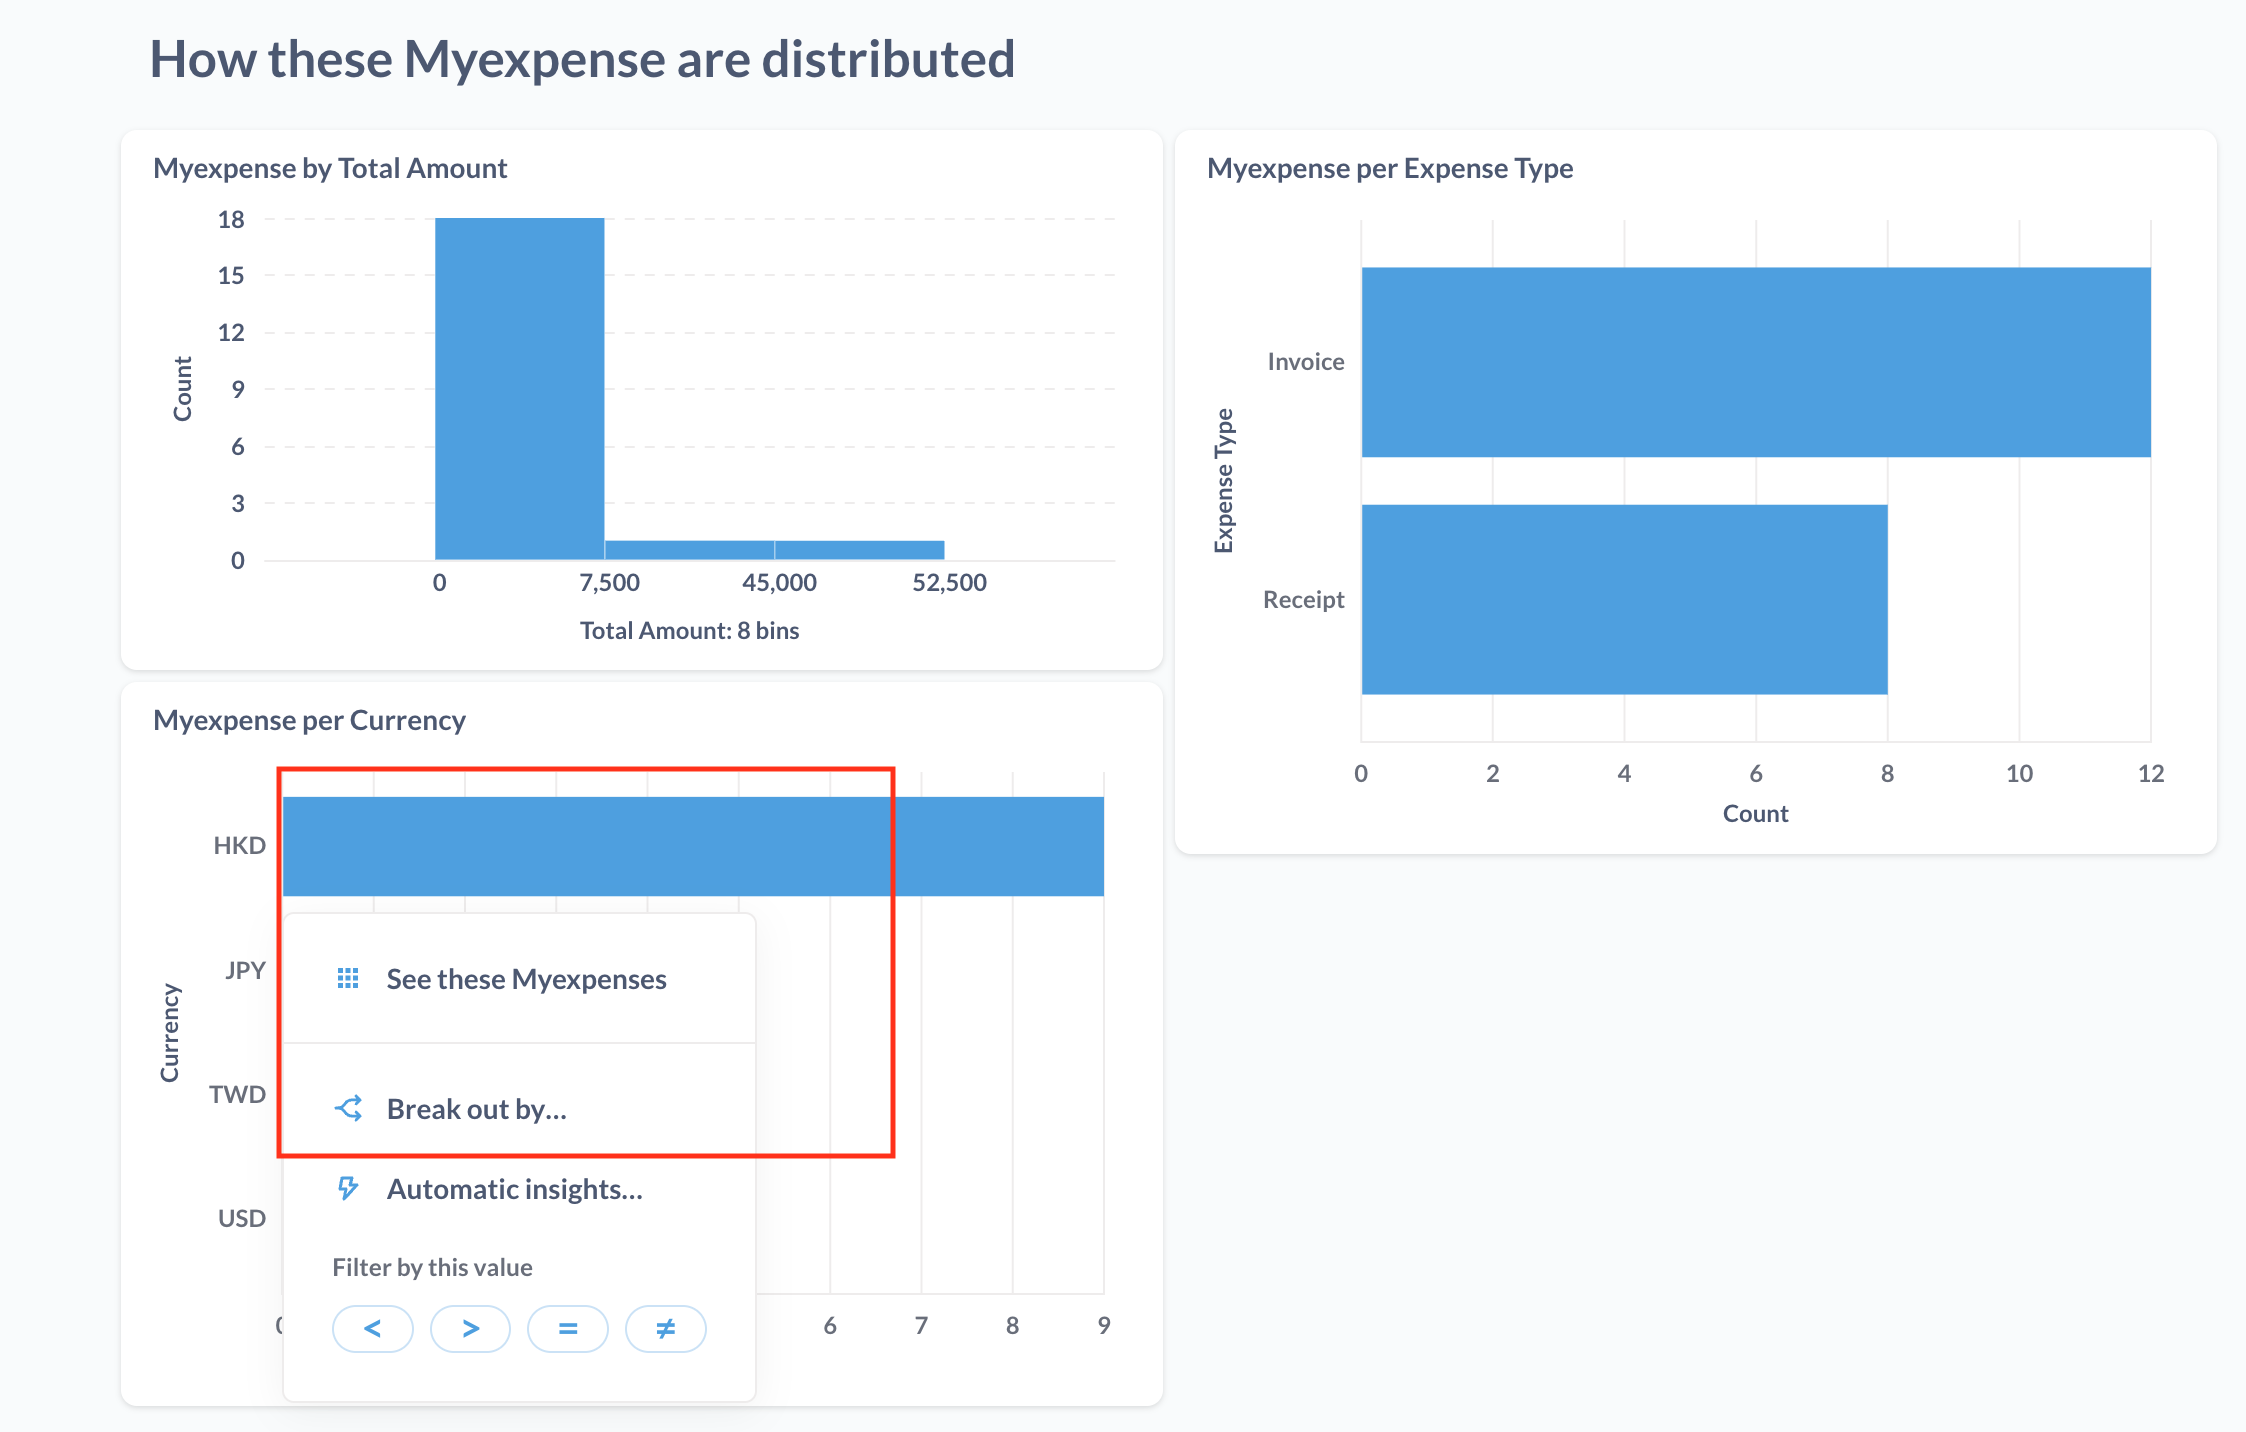
Click the “Break out by” button to perform analytics on HKD expenses.
At the next drop down menu, select to break down by expense category.
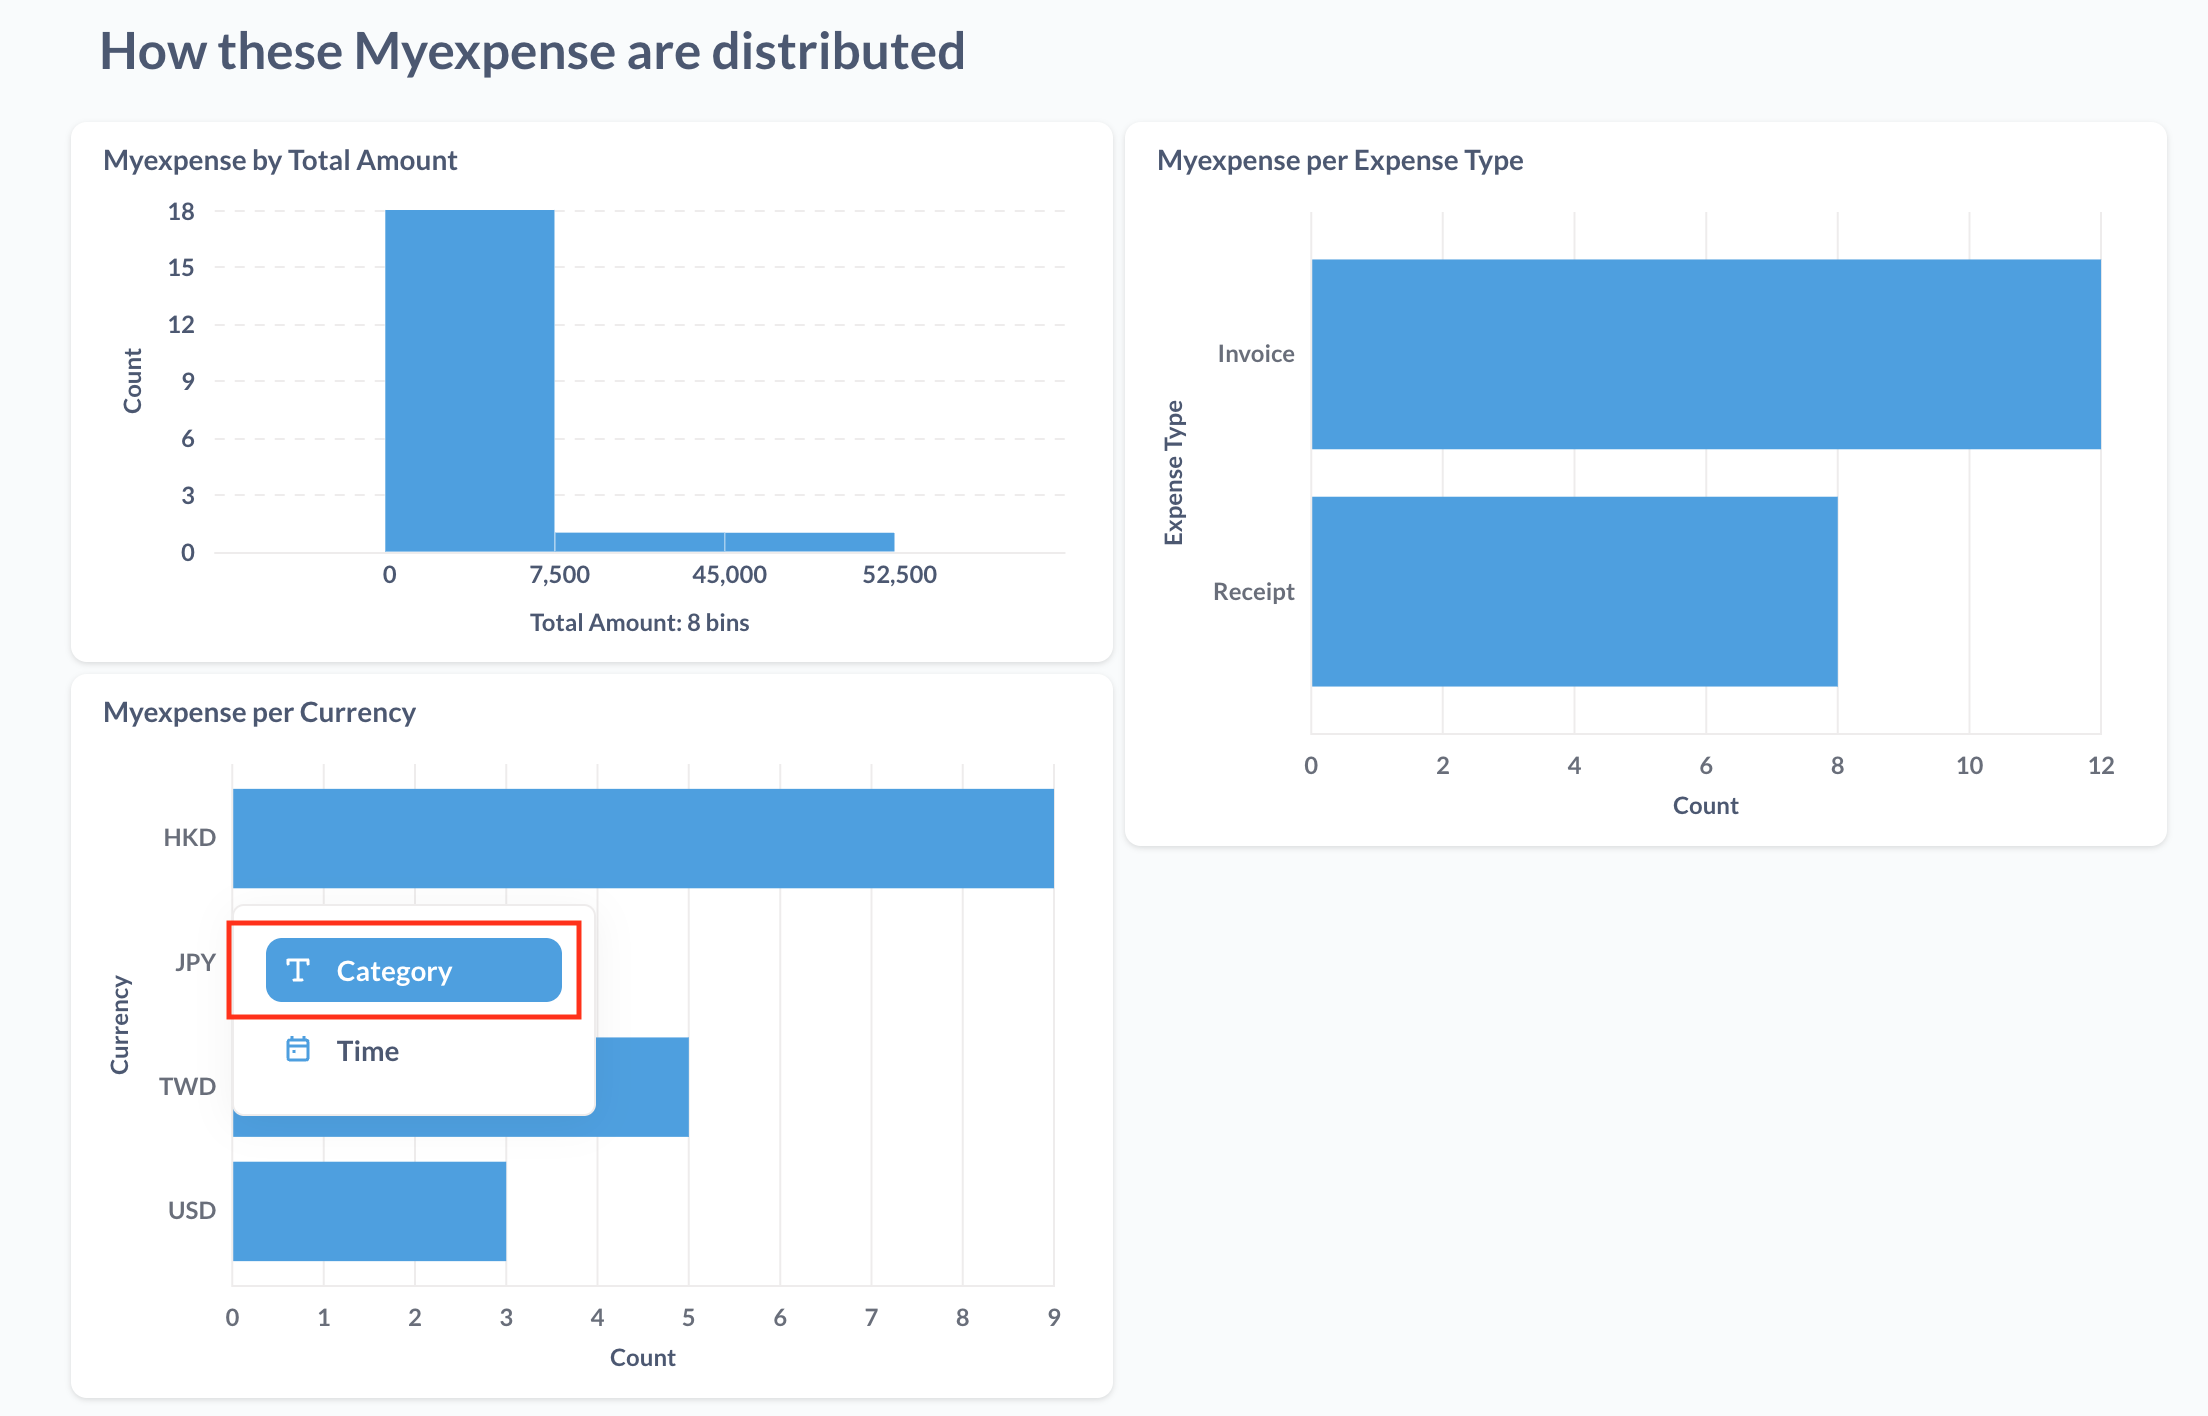
At the next drop down menu, select “Expense Category”.
The you will be able to see the chart, which is by expense category (x-axis), and then by number of expenses (y-axis).
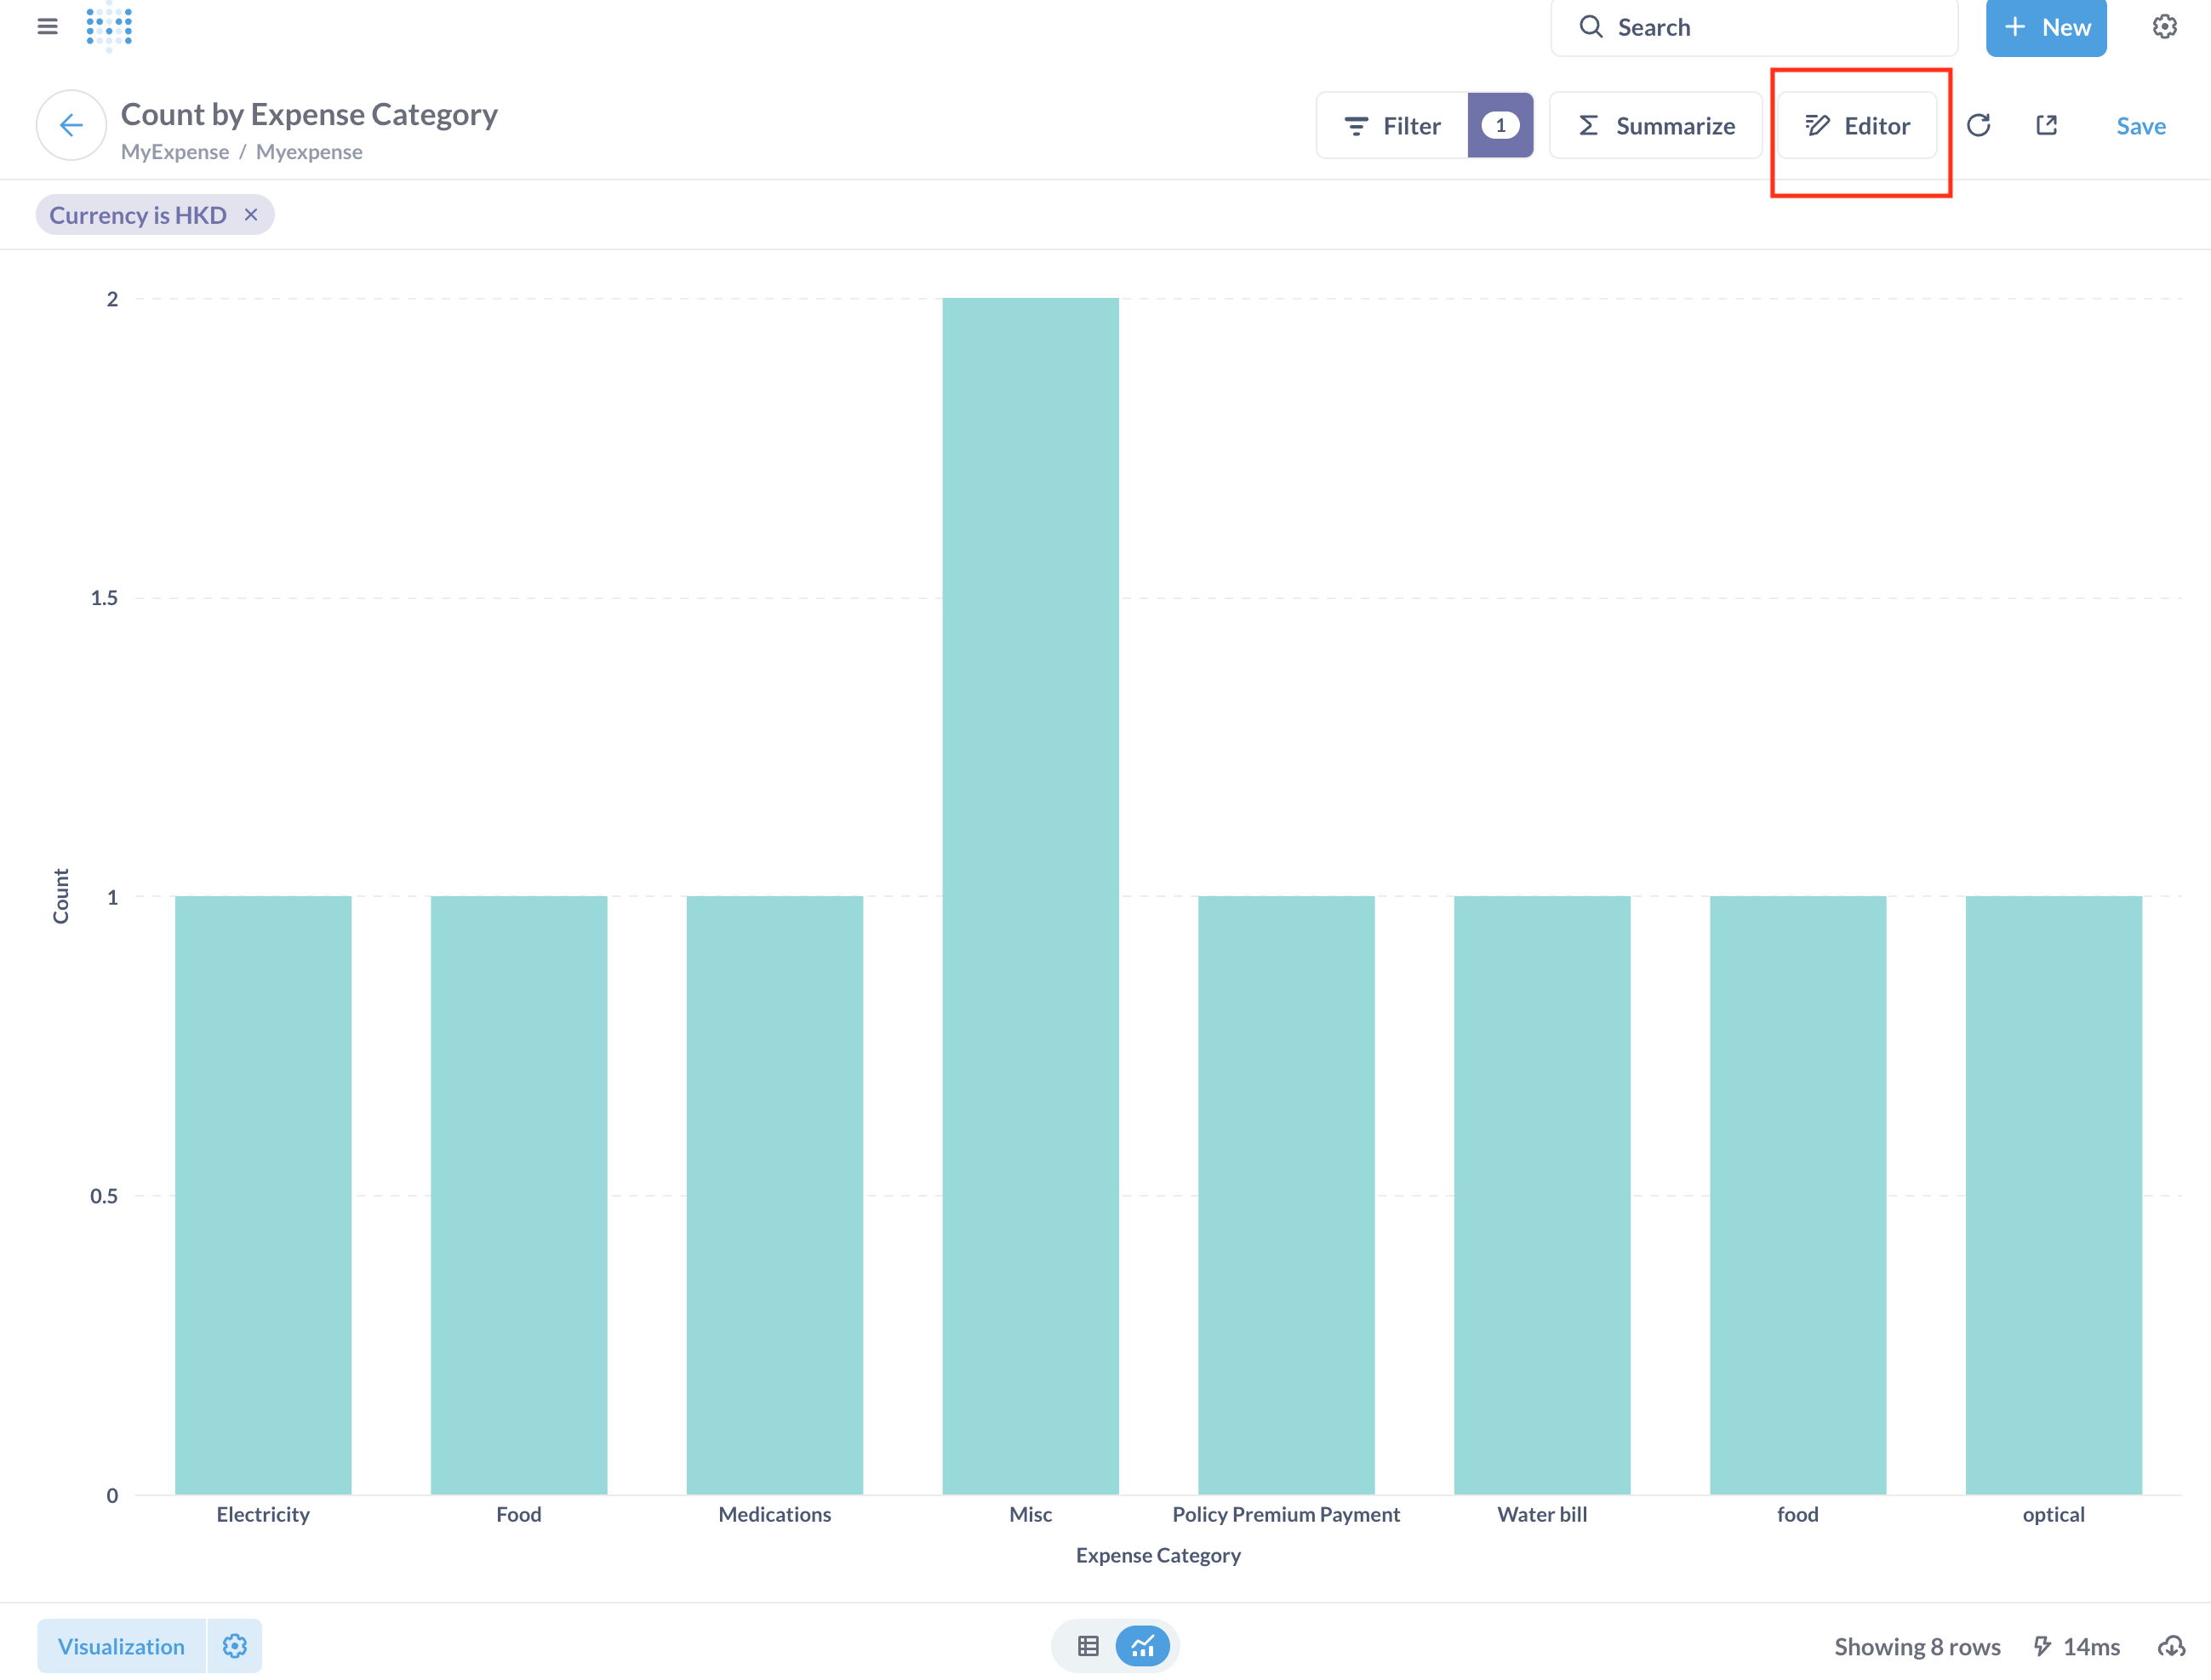
Suppose we want to see the amount instead of transactions count. Click into the “Editor” button to enter the chart editor.

In the “Summarize” section, add Sum of “Total Amount”, and delete “Count”.
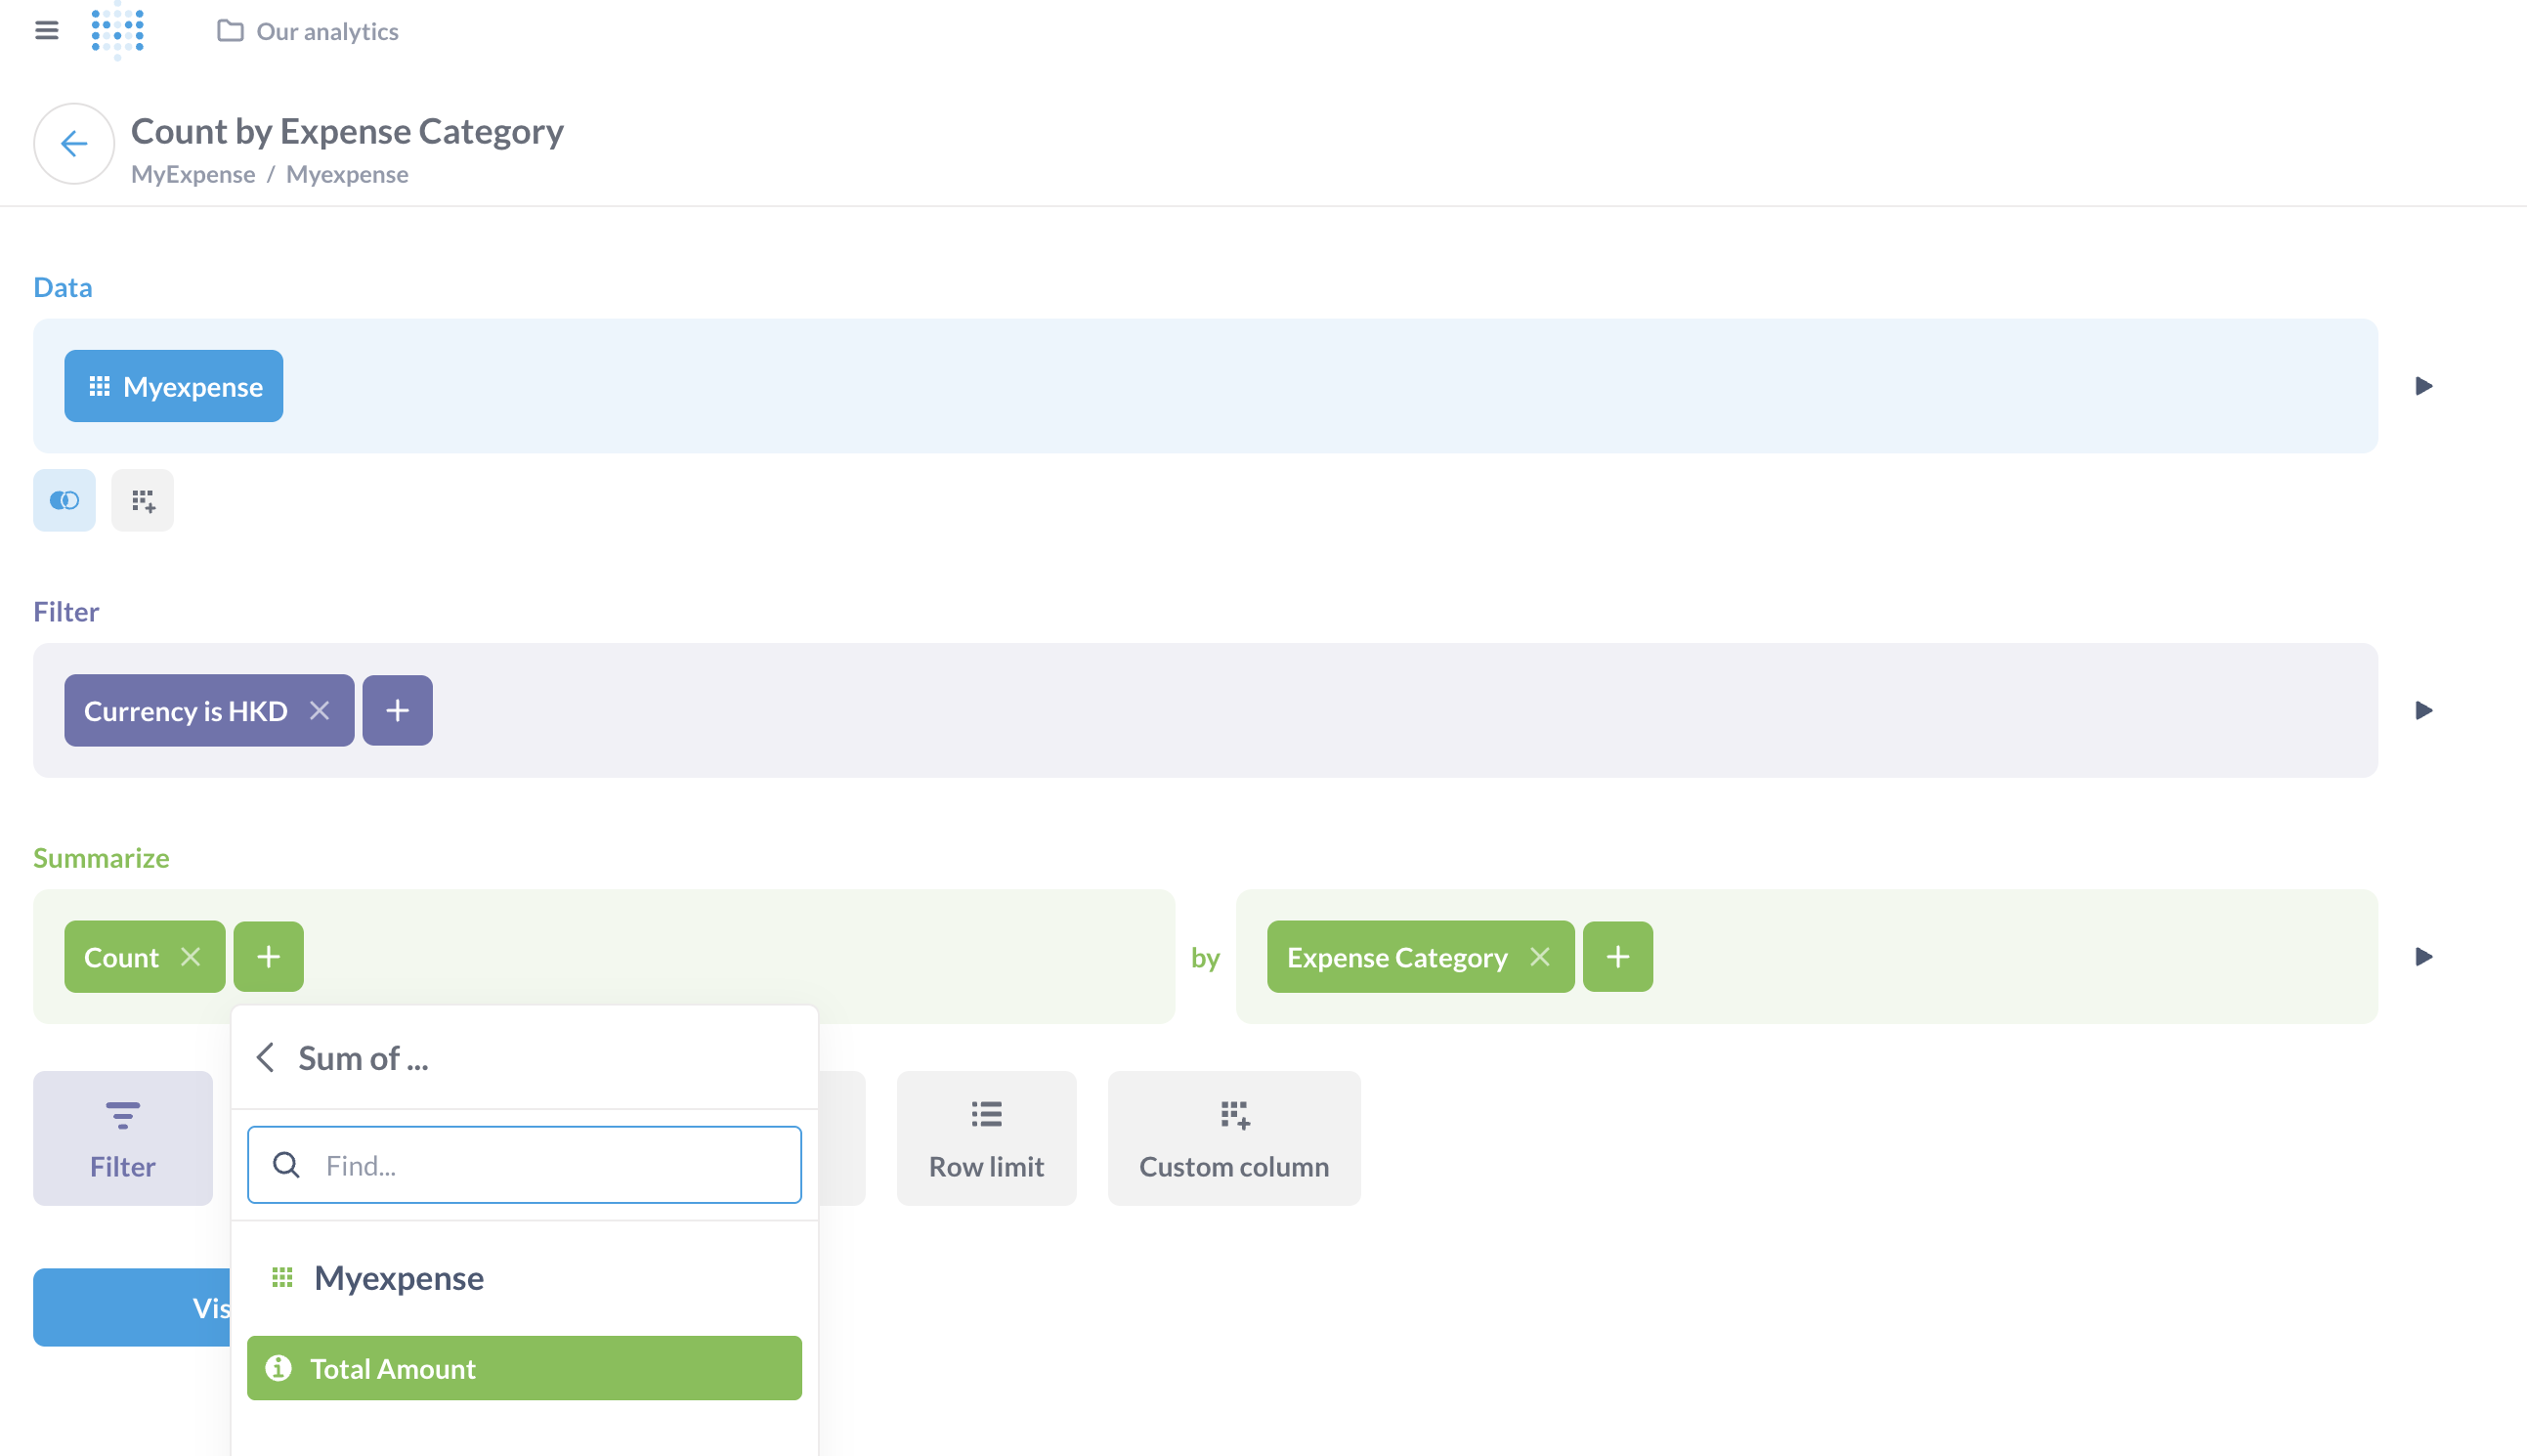
The following is the result screenshot.
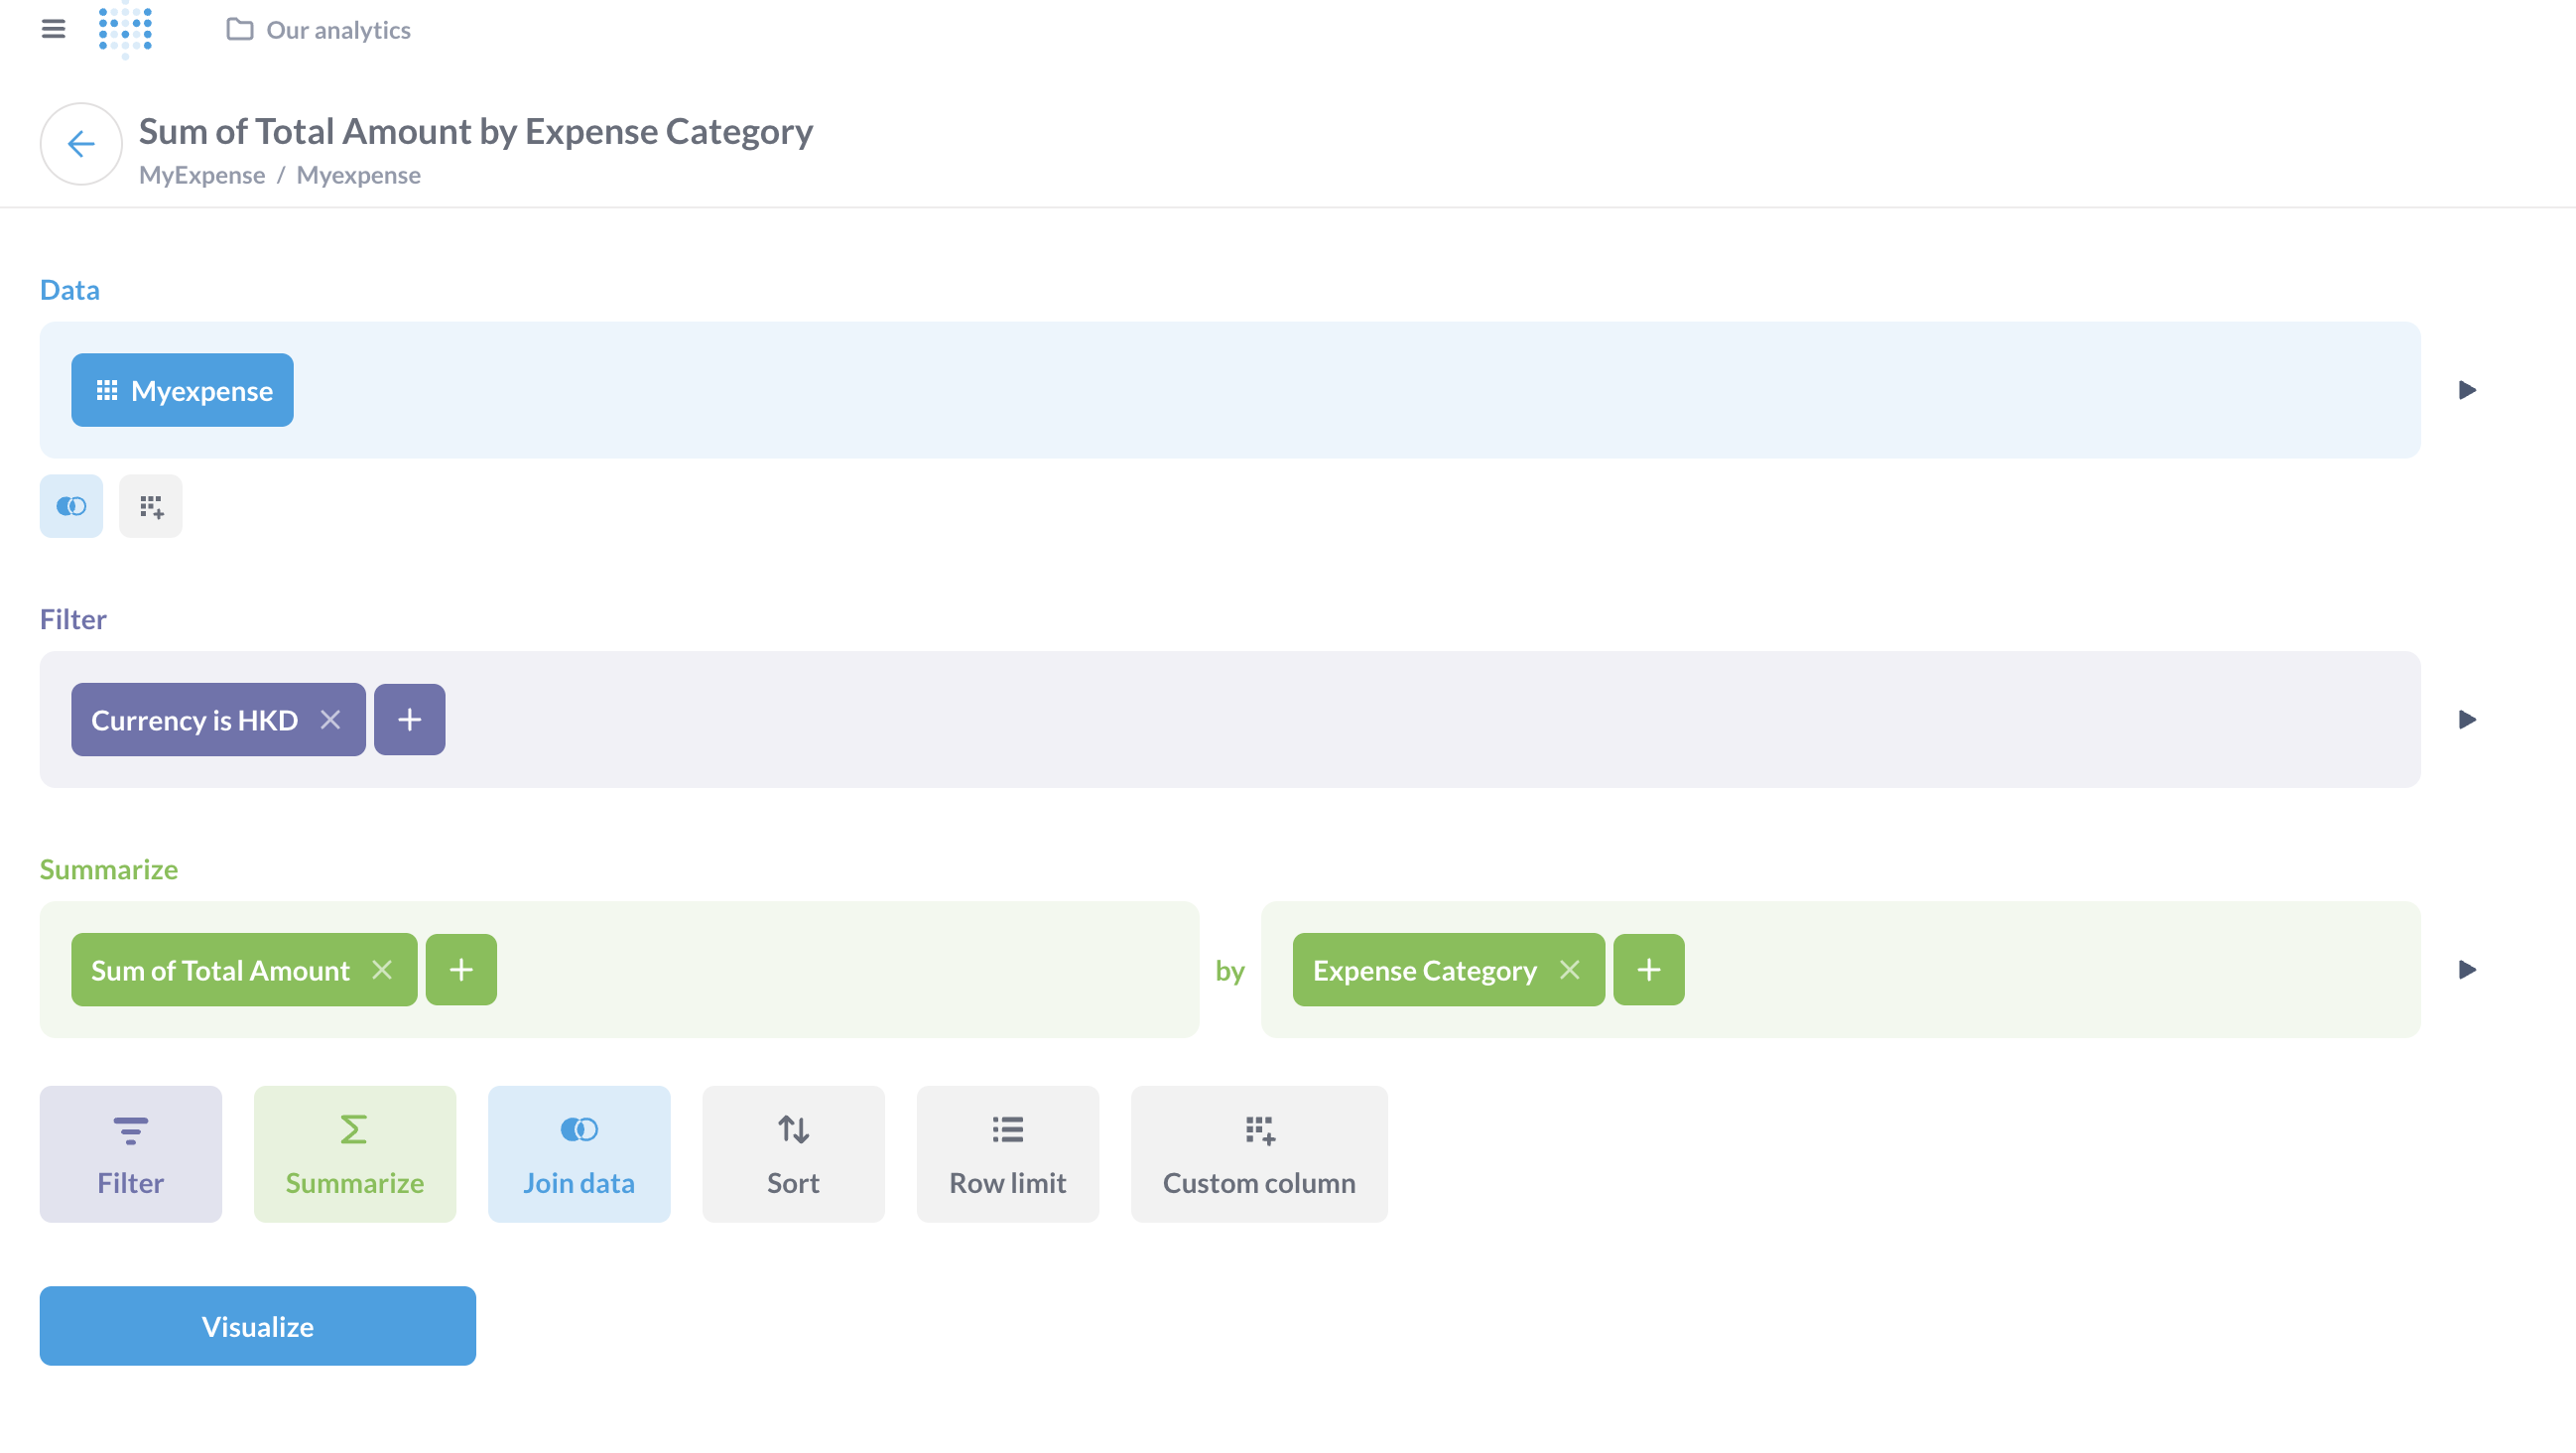
Click “Visualize” to view the chart.
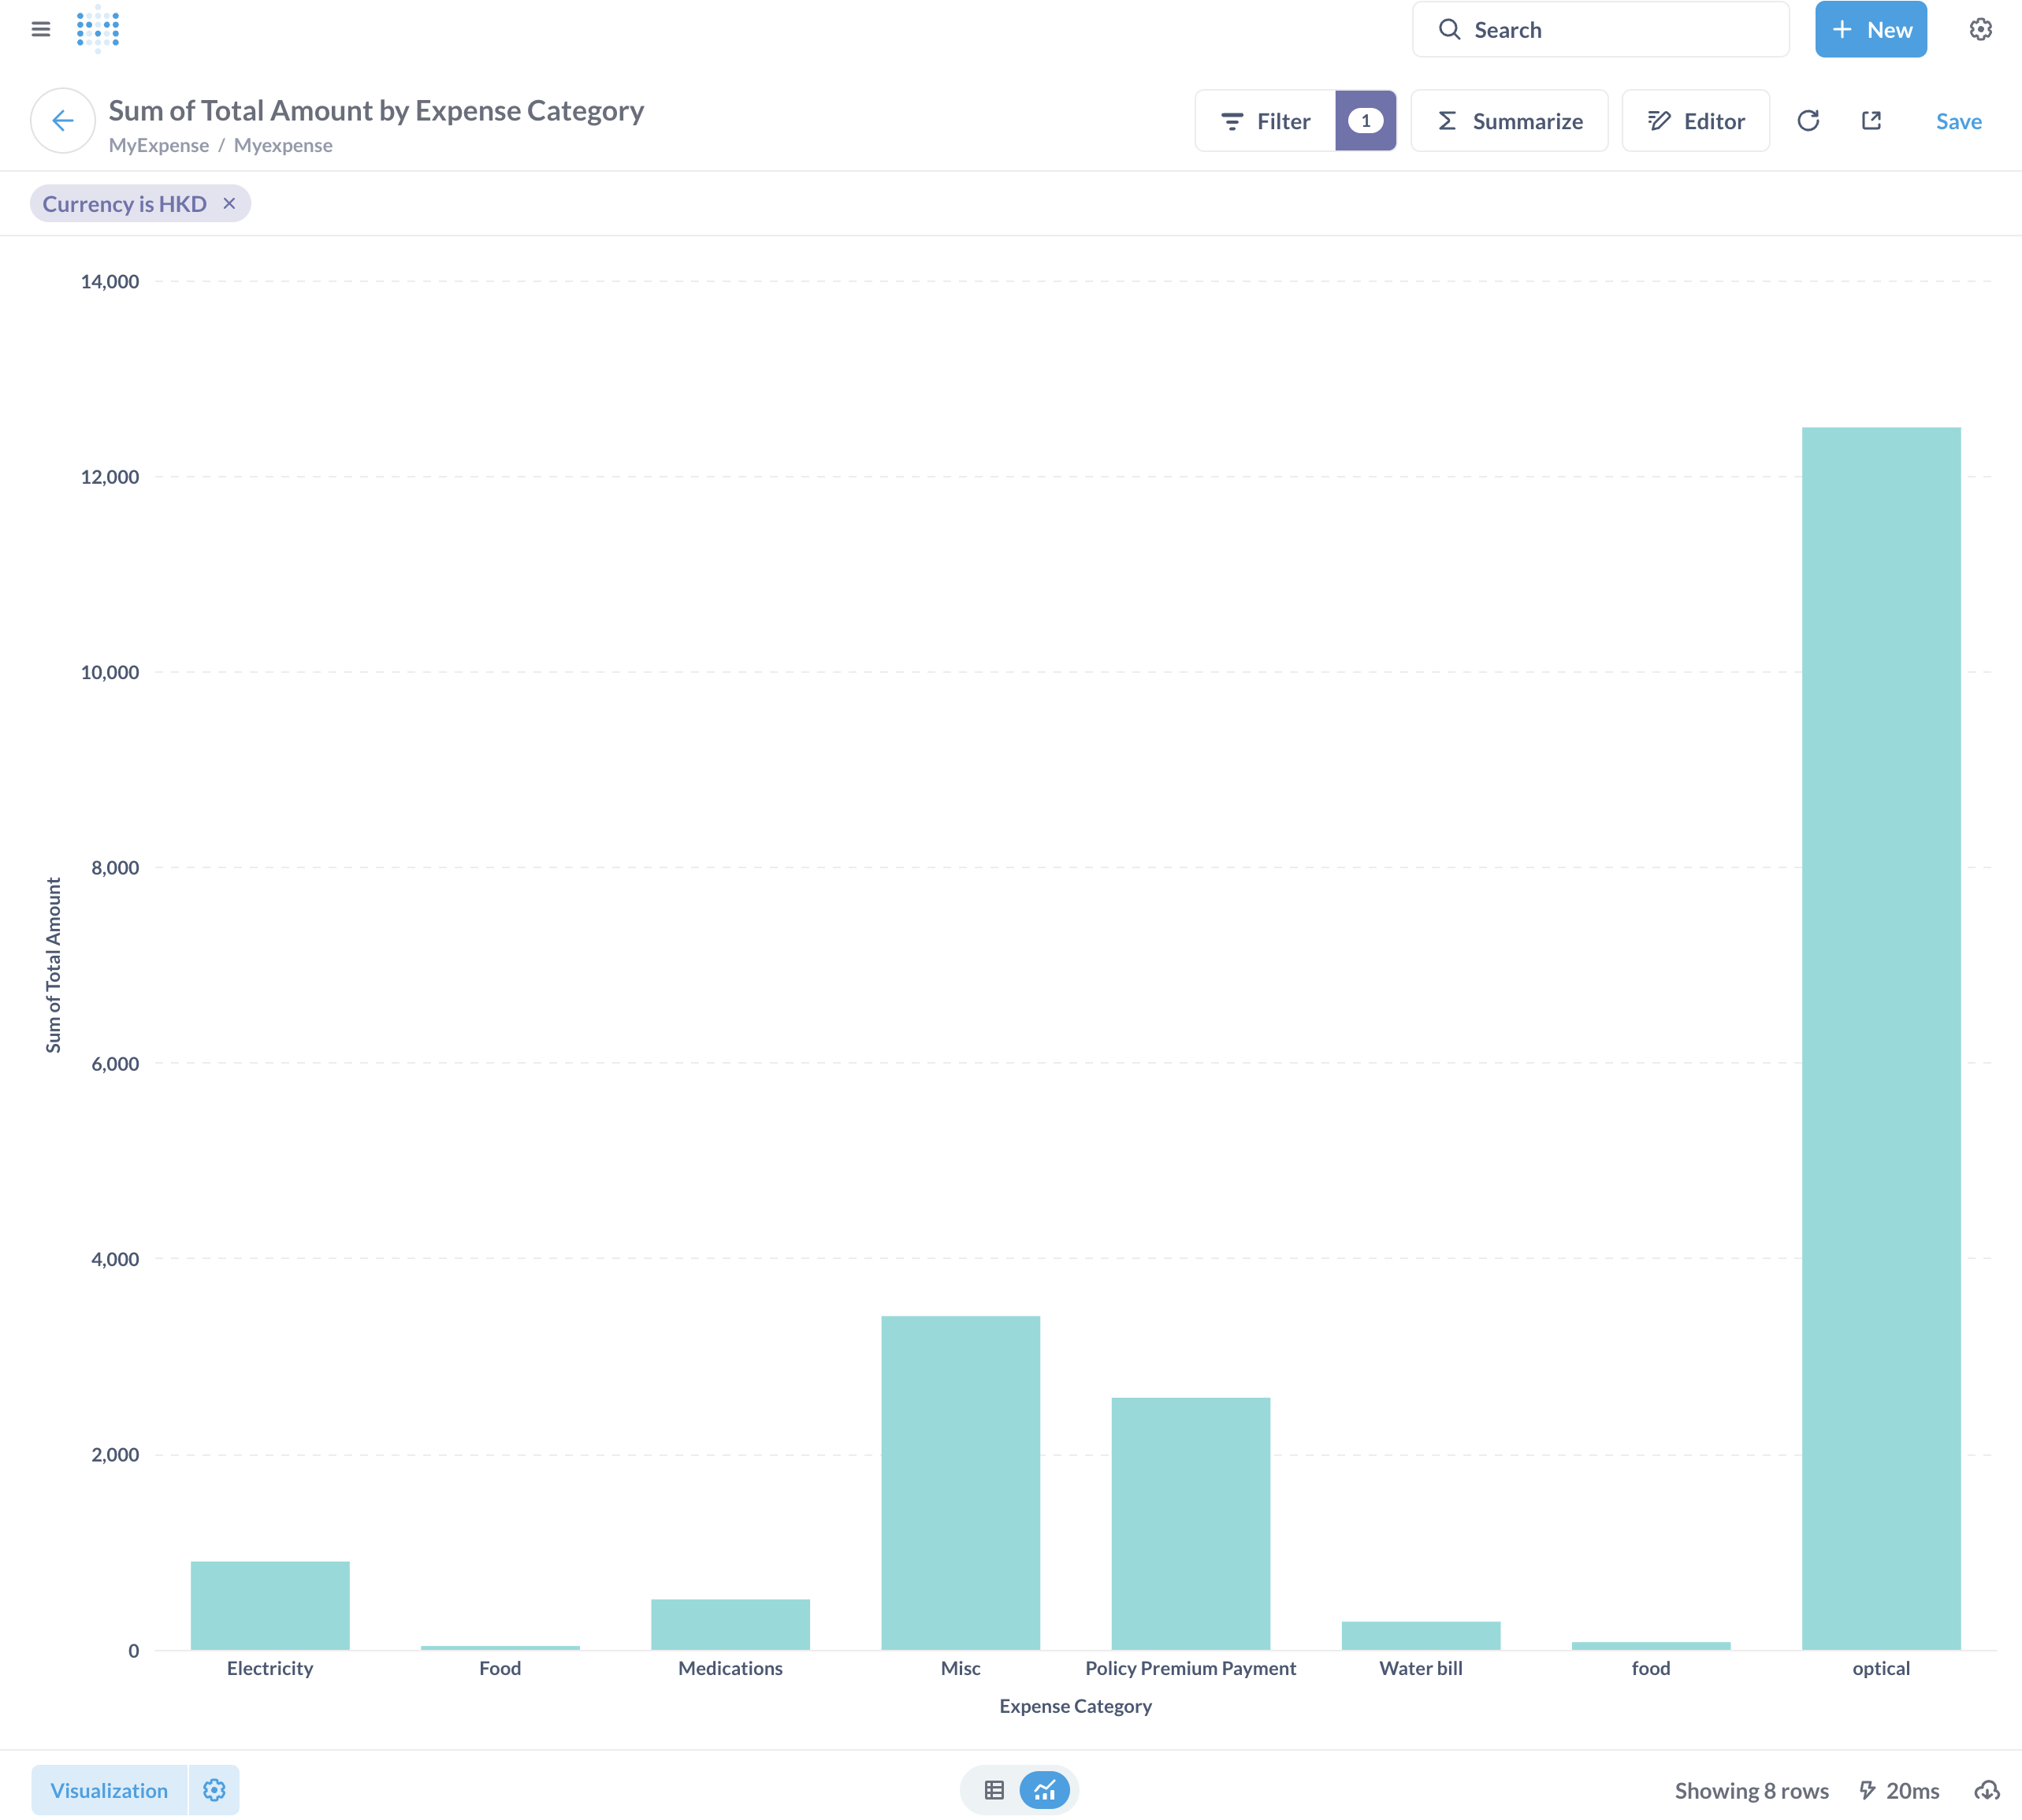
You will be able to see the distribution of amount by categories, which are inferred by UnderDoc’s LLM during structured output extraction from expense images.
You can save this chart, put it into your own dashboard, or share it with others. Metabase has so many features that I am simply not able to cover.
If you want to see details of each expense, you can also click “See this Myexpenses” when mouse over a particular bar in a chart.
Python Code Explanation
Finally, would like to give you an overview of the Python code in this tutorial.
model.py
In this file, we defined a model class named “MyExpense”, which include the fields we want to be stored into the database.
|
|
The model class inherit the SQLModel class from the Python package “sqlmodel”, which use “Pydantic” and “SQLAlchemy” behind the scene.
main.py
This is the main Python script that runs the whole process and the highlevel flow is:
- Read the expense image files in the path IMAGE_FILE_PATTERN, invoke UnderDoc’s SDK to extract the data from image files in batch mode (the function extract_expense_data_from_images())
- Create a session to the target SQLite DB
- For each expense item extracted in the response, get the fields we want and construct an instance of the class MyExpense, and then add the record to the database session
- Finally, commit the session, which will persist the records into the database
|
|
Resources
Conclusion
This tutorial provided a step-by-step guide on extracting multi-currency, multilanguage structured data from a batch of expense images and persist it into a database. Then use Metabase to perform interactive expense data analytics.
I hope you will find this tutorial interesting and helpful. If you have any comments or questions, please feel free to contact me (clarence@underdoc.io) and I am very happy in answering!
I also plan to create Part 2 of this tutorial, which use another container tool (Podman) and database (PostgreSQL), which provides more features like edit the data directly from Metabase. Stay tuned.